10 Proven Workforce Quality Metrics Leaders Must Track in 2026
Discover the 10 workforce quality metrics that top US HR and Finance leaders track to cut attrition, close pay gaps, and scale headcount with confidence.


For most HR and Finance leaders, workforce data is scattered across spreadsheets, emails, and various tools, making it hard to see the full picture. Without real-time insight into workforce quality, you’re essentially flying blind—leaving critical gaps in pay equity, retention risk, and budget alignment.
Here’s the problem: Most teams are tracking activity, like headcount filled or offer acceptance rates, but not the key signals that actually predict retention, expose pay inequities, or highlight misaligned budgets. By the time issues surface, it’s too late. You’re left scrambling to mitigate high turnover costs, correct budget overruns, or fix pay gaps, after the damage has already been done.
But this doesn't have to be the case.
In 2026, workforce quality metrics are no longer optional. They are your early warning system, giving you real-time visibility into the health of your workforce and enabling strategic decisions that drive sustainable growth.
Key Takeaways
- Most US HR and Finance teams track workforce activities like headcount filled, cycles, but not workforce quality signals like comp band adherence, regrettable attrition, and pay equity ratios that predict retention risk and budget exposure.
- HR and Finance misalignment is one of the most expensive and preventable causes of poor workforce quality; a shared, real-time data system eliminates the gap between what HR tracks and what Finance approves.
- The 10 workforce quality metrics that matter most include compensation band adherence rate, pay equity ratio, regrettable attrition rate, internal mobility rate, and headcount plan vs. actuals variance, each tied directly to business outcomes, not just HR operations.
- AI is no longer optional in workforce planning. Platforms like CandorIQ use AI to surface comp recommendations, forecast attrition risk, and answer natural language planning questions, compressing hours of analysis into seconds.
- Measuring workforce quality is not a one-time audit. It is an ongoing system — and companies that build it early scale faster, spend less on regrettable turnover, and make headcount decisions with far greater confidence.
.png)
What Are Workforce Quality Metrics?
Workforce quality metrics are the data points that measure the structural health of how your people are hired, compensated, developed, and retained. Workforce quality metrics are different from workforce productivity metrics and standard HR operational metrics. Here is how they compare:
The distinction matters because you can have a productive workforce that is quietly fragile. High output with low pay equity, no internal mobility path, and a compensation cycle that runs eight weeks is a retention crisis waiting to surface.
10 Essential Workforce Quality Metrics to Track in 2026
Traditional HR metrics measure what HR does. Workforce quality metrics measure whether those actions are building a durable, fairly structured organization. These are the metrics that matter for US HR and Finance leaders who want to move from reactive to strategic.
1. Compensation Band Adherence Rate
Definition: The percentage of employees whose compensation falls within the approved pay band for their role, level, and location.
This is the foundation of pay governance. If 30% of your workforce sits outside defined pay bands, your compensation strategy is a policy on paper, not in practice. A healthy benchmark is 90% or above. Below that, you likely have inconsistent hiring decisions, manager-level exceptions that compound over time, and real pay equity risk.
2. Pay Equity Ratio By Role, Level, And Location
Definition: The ratio of compensation across demographic groups within the same role and level, adjusted for location.
Pay equity is no longer just a DEI commitment. It is a legal and reputational risk factor. For US companies with distributed teams, geo-adjusted equity analysis is essential. A ratio above 0.98 is generally considered equitable. Anything below 0.95 warrants immediate review.
3. Regrettable Attrition Rate
Definition: The percentage of departures who were high performers or flight risks you wanted to retain, expressed as a share of total turnover.
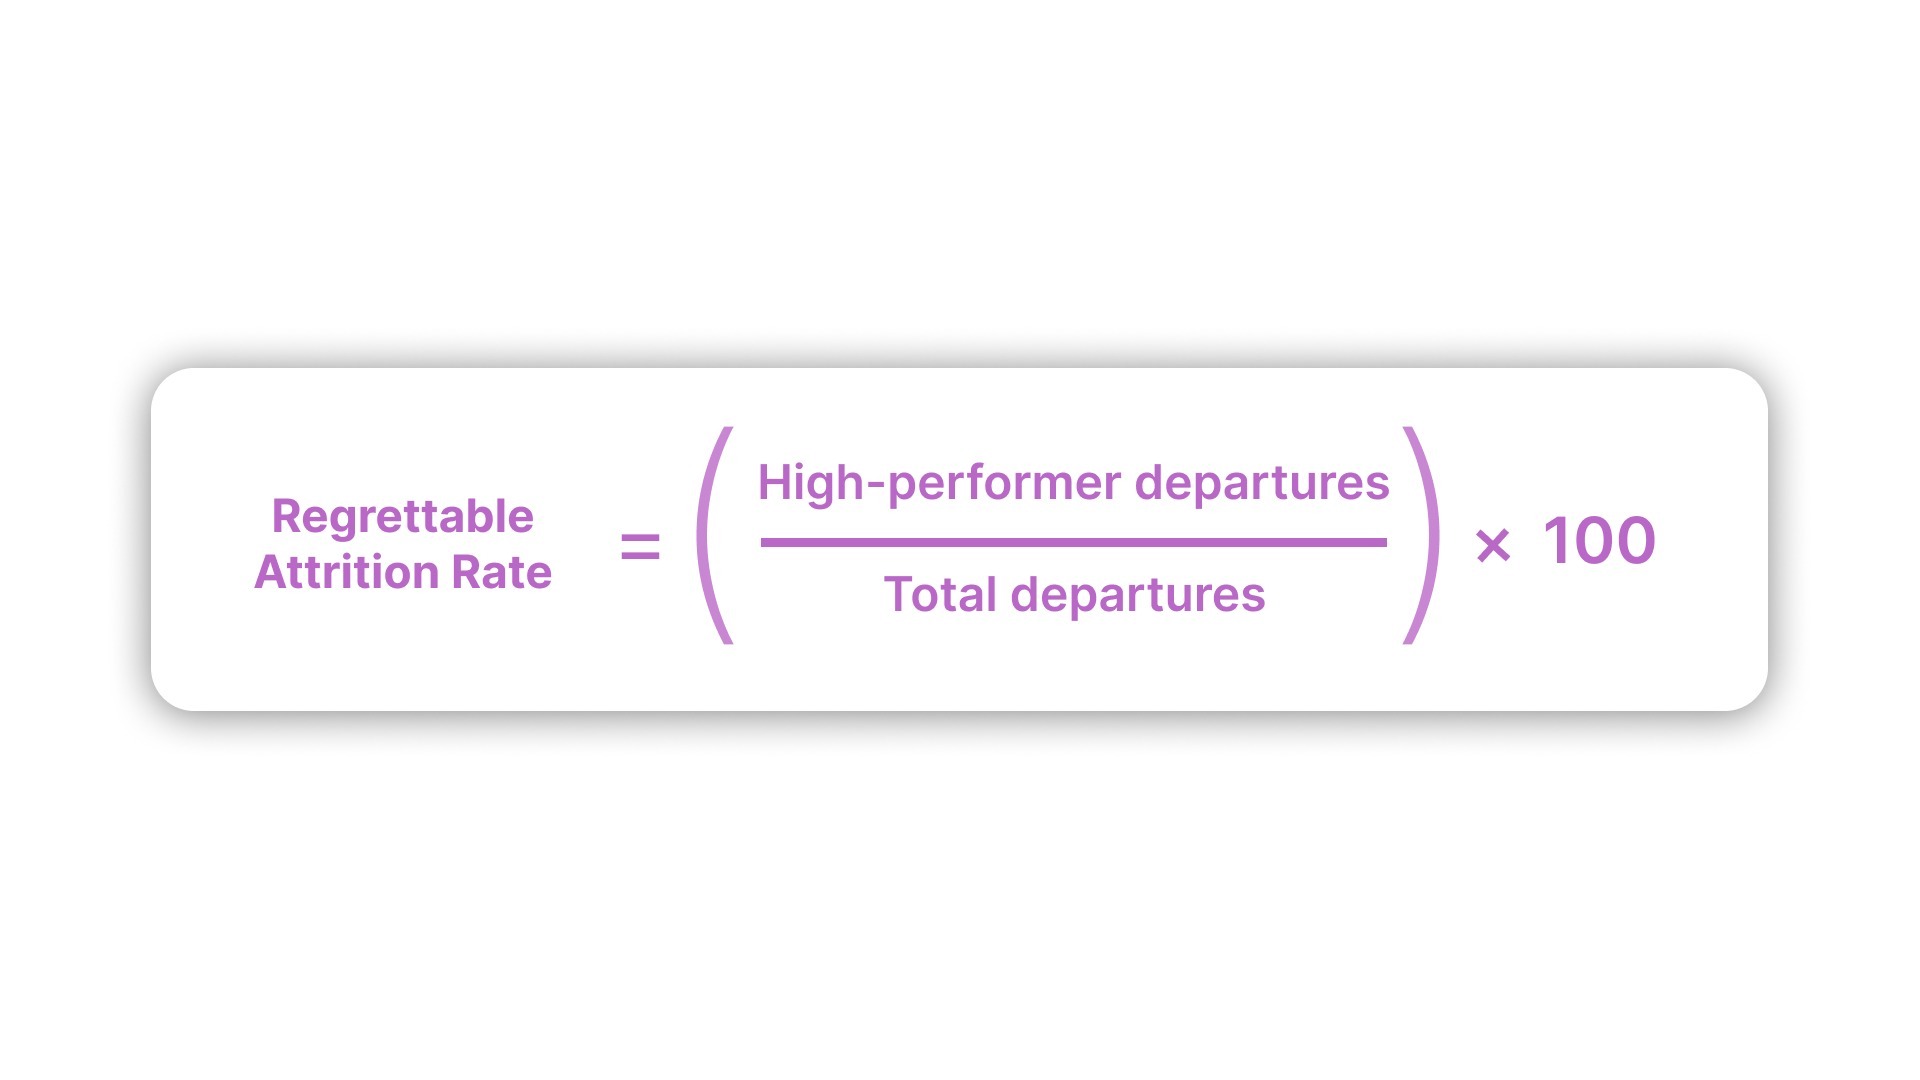
Regrettable Attrition Rate = (High-performer departures ÷ Total departures) × 100
Most HR teams track total attrition. The ones who track regrettable attrition make better decisions. Losing a low performer and losing a top performer are fundamentally different events with different financial and cultural consequences. A regrettable attrition rate above 25% of total turnover is a retention alarm worth acting on.
4. Internal Mobility Rate
Definition: The percentage of open roles filled by internal candidates, including lateral moves and promotions.
Internal mobility is one of the strongest signals of workforce quality. It means your organization develops people, not just hires them. A rate above 20%–25% is a healthy target for most mid-sized US companies.
Below 10% signals that people do not see a future inside your organization, which is a retention risk that attrition data will confirm six months too late.
5. Offer Acceptance Rate By Comp Tier
Definition: Offer acceptance rates segmented by where the offer falls within the compensation band, bottom quartile, midpoint, or top quartile.
Aggregate offer acceptance rates hide critical information. If your overall acceptance rate is 78%, but it drops to 55% for offers in the bottom quartile of your band, your comp bands are not competitive at the low end. This metric tells you exactly where your compensation strategy is losing candidates.
In CandorIQ, offer outcomes are automatically segmented by where each offer lands within the compensation band. So, you can spot pattern-level comp gaps without building a pivot table after every hiring cycle.
6. Headcount Plan Vs. Actuals Variance
Definition: The difference between approved headcount targets and actual filled seats, measured monthly and by department.
This is the metric that Finance cares most about, and HR often cannot answer in real time. A variance of more than 10%–15% over a quarter signals a planning process that is disconnected from execution. For budget-sensitive CFOs at fast-growth companies, this number sitting in a spreadsheet is a governance problem.
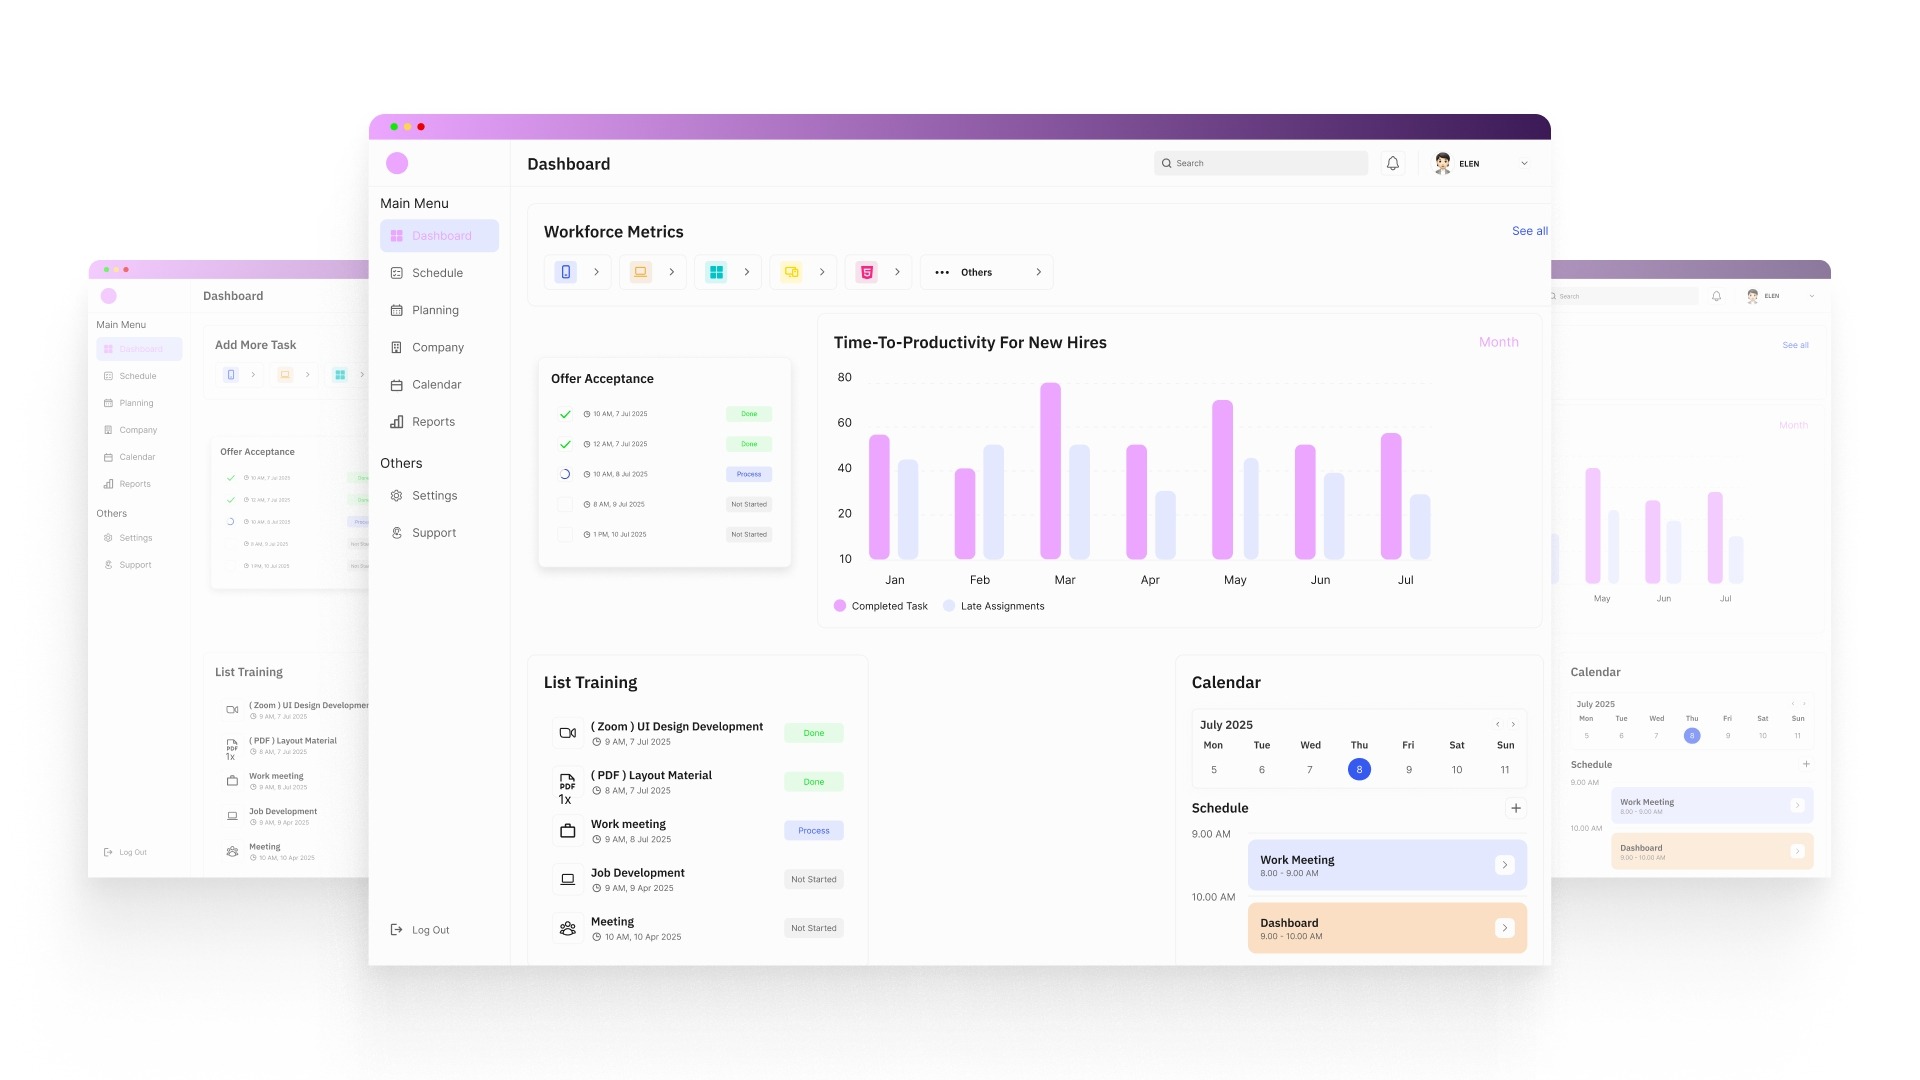
7. Time-To-Productivity For New Hires
Definition: The average time it takes a new hire to reach full performance output, by role type and department.
Time-to-fill gets all the attention. Time-to-productivity tells you whether your hiring and onboarding process is actually working. The benchmark varies by role, for example, 3 months for individual contributors, 6 months for managers, and it is a reasonable target. Anything significantly above that warrants a review of onboarding quality, not just hiring speed.
8. Manager Span-of-Control Ratio
Definition: The average number of direct reports per manager, segmented by level and department.
Span of control is a leading indicator of organizational health. Too wide (10+ reports per manager at scale), and your managers cannot develop their teams. Too narrow (2–3 reports at scale), and your management costs are inflated.
For most US mid-sized companies, 5–7 direct reports per manager is the optimal range.
9. Compensation Cycle Completion Time
Definition: The number of days it takes to complete a full compensation review cycle, from initiation to final approval.
This is one of the most overlooked workforce quality metrics. The average compensation cycle in mid-sized companies takes 6–8 weeks. That means for two months a year, managers are making decisions based on tentative data. Whereas employees are waiting for outcomes that affect retention. Also, your Finance has no clear view of the final payroll impact.
Cutting that cycle to 2–3 weeks with structured workflows is a measurable quality improvement.
10. Employee Retention Rate By Pay Tier
Definition: Retention rates segmented by whether employees are paid below, at, or above the midpoint of their compensation band.
This metric connects compensation directly to retention. In most organizations, employees paid below the band midpoint are 2x more likely to leave within 12 months than those paid at or above it. If your retention strategy does not account for where people sit within their band, it is missing the most predictive variable.
CandorIQ surfaces this metric by cross-referencing compensation band position with retention data. This gives your HR an early warning on which employee segments are most at risk.
Also Read: Top HR Metrics to Track for Success in 2026
Once you know what to track, the natural next question is, what does a proper workforce quality metrics system actually look like to build and operate?
How to Build a Workforce Quality Metrics Dashboard in 5 Steps
Understanding the metrics is useful. Building a system that surfaces them consistently is what makes the difference. Here’s how you can build a workforce quality metrics dashboard:
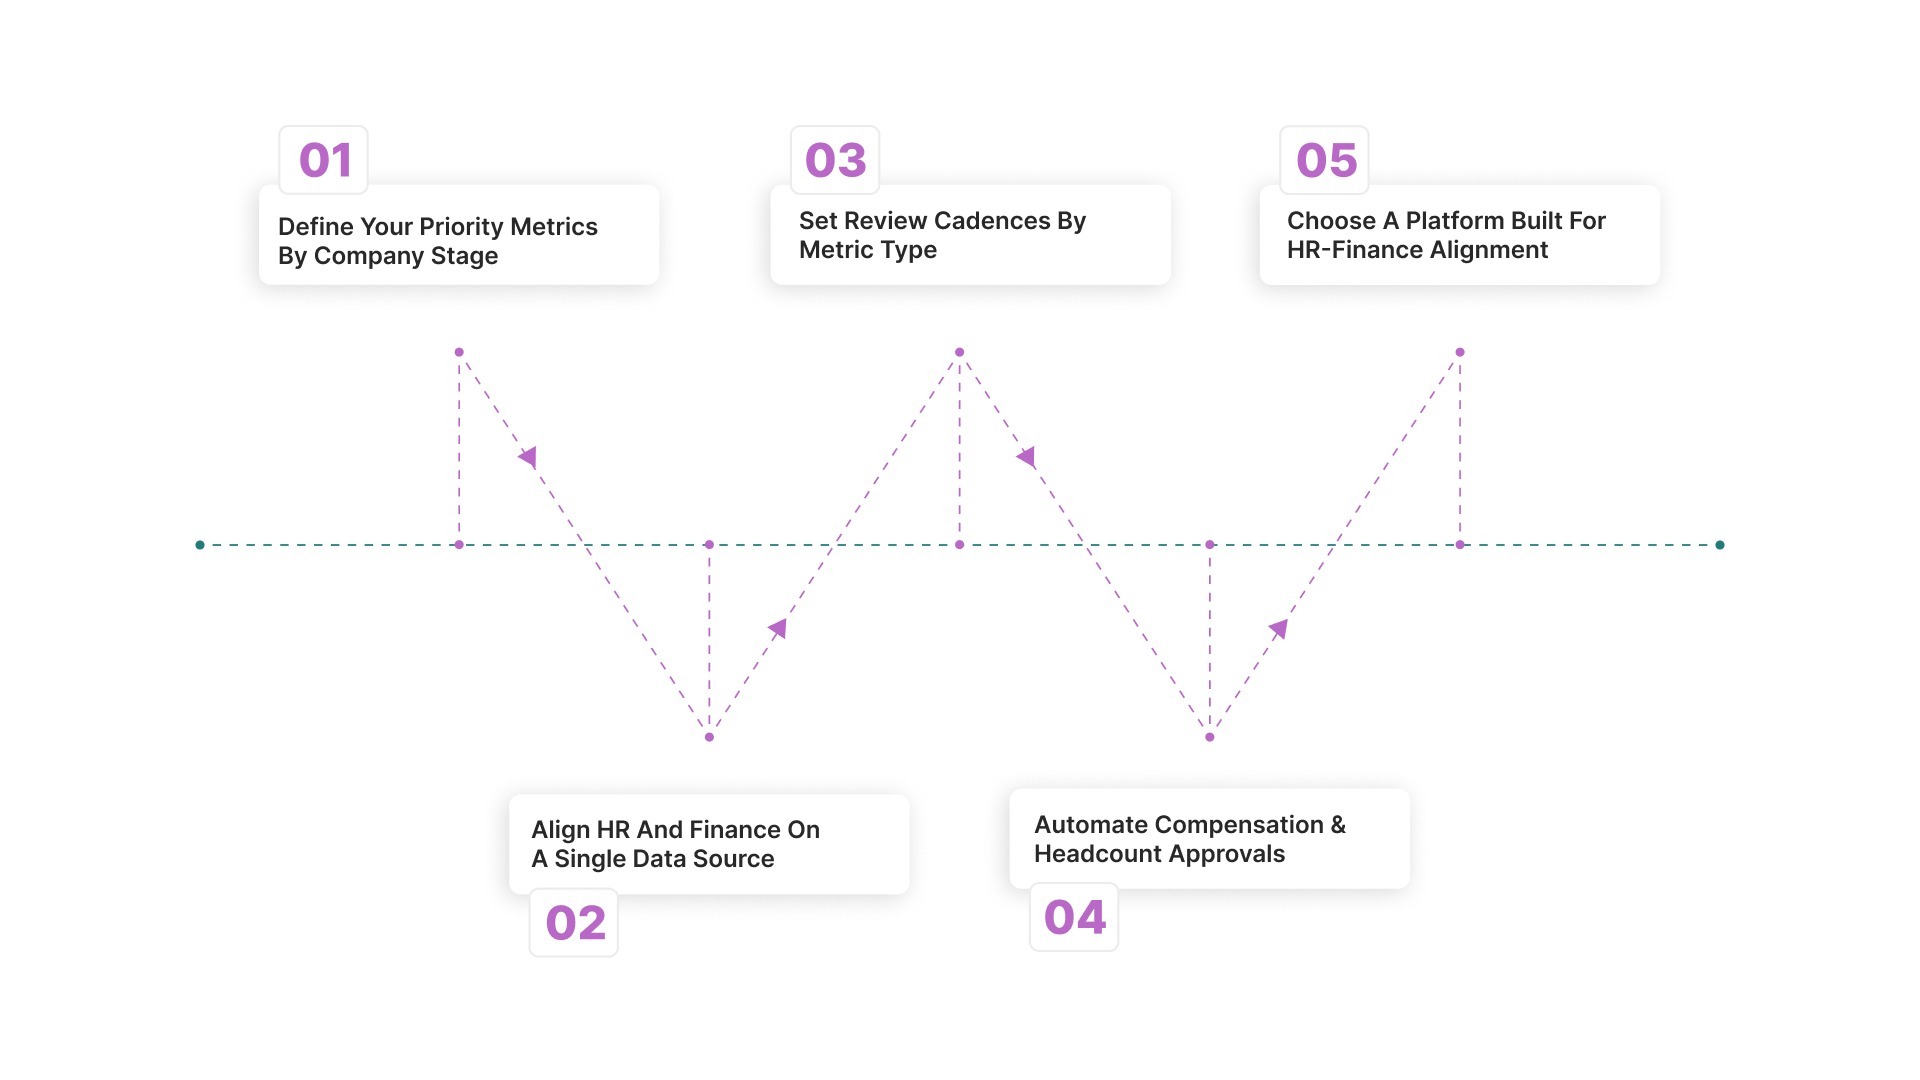
Step 1: Define Your Priority Metrics By Company Stage
A 100-person company scaling to 300 should focus on comp band adherence, regrettable attrition, and offer acceptance by comp tier. A 1,000-person company managing distributed teams needs pay equity ratios, span-of-control data, and headcount plan vs. actuals across departments. Start with the decisions you need to make, then work backwards to the data.
Step 2: Align HR And Finance On A Single Data Source
The most expensive thing you can do is have HR and Finance maintain separate headcount and compensation records. A single source of data, not a shared spreadsheet, but a connected system, is the foundation of every other step.
This is where most companies stall. CandorIQ solves it by giving HR and Finance a shared, real-time view of compensation and headcount data. So both teams are working from the same number at the same time, not reconciling different spreadsheets after the fact.
Step 3: Set Review Cadences By Metric Type
Not all metrics need weekly attention. For compensation band adherence, review quarterly. Review your pay equity biannually. Regrettable attrition and retention by pay tier, review monthly. Headcount plan vs. actuals, review weekly during high-growth periods.
Step 4: Automate Compensation And Headcount Approval Workflows
Manual approval chains are where quality data goes to die. When a manager approves a compensation exception via email, there is no audit trail, no budget impact visibility, and no equity check. Automated workflows with built-in approval logic and budget tracking eliminate these gaps.
Step 5: Choose A Platform Built For HR-Finance Alignment
For US companies managing distributed teams with geo-adjusted compensation, a platform that consolidates comp bands, headcount planning, and approval workflows in one place has become a structural requirement. This is especially true for teams where HR has 1–10 people managing comp ops for hundreds of employees.
Also Read: Workforce Analytics: Examples, Benefits, and Best Practices
Along with this, you also need to understand how AI is reshaping the way modern HR teams actually interpret and act on workforce quality data.
The Role of AI in Tracking Workforce Quality Metrics in 2026
AI is changing how HR teams interact with workforce data. Not by replacing judgment, but by compressing the time between question and answer.
Ai-Driven Compensation Recommendations
Instead of benchmarking comp manually against survey data, AI can surface compensation recommendations based on historical ranges, peer company benchmarks, and internal equity signals simultaneously.
For example, CandorIQ's AI Agent simultaneously surfaces compensation recommendations based on internal benchmarks, historical ranges, and peer data.
So a recruiting manager making a late offer has the same quality of context as one running a full comp analysis mid-cycle.
Natural Language Workforce Analysis.
Modern workforce platforms now let HR and Finance leaders ask questions like "what is our regrettable attrition rate in the West Coast engineering team over the last two quarters?" and get an answer in seconds. The value is not in the technology. It is in the time that used to be spent building that analysis in a spreadsheet.
Predictive Attrition Modeling
When you combine retention by pay tier, internal mobility rate, and comp band adherence in a single platform, the data starts to predict risk. Employees who are paid below the band midpoint, have not had a promotion in 18 months, and sit in a high-attrition function are identifiable before they start looking. That is the shift from reactive HR to strategic HR.
You're probably already feeling the pain of trying to manage workforce quality without the right system. Here's what that system looks like in practice.
How CandorIQ Turns Workforce Quality Metrics into Strategy
Managing workforce quality without the right infrastructure is harder than it looks. Most US HR teams are juggling compensation data in spreadsheets, headcount approvals over email, and pay equity reviews that happen very rarely.
CandorIQ is a unified compensation and headcount planning platform built specifically for US growth-stage companies that need more than disconnected tools. It brings pay bands, compensation cycles, headcount planning, and approval workflows into one system, giving HR and Finance shared, real-time visibility into the metrics that actually drive workforce quality.
- Compensation & Pay Band Builder: Define pay bands by role, level, and location with real-time distribution views. See exactly where every employee sits within their band, and flag exceptions before they become equity issues.
- Compensation Cycle Automation: Replace manual email approvals with structured workflows that route sign-offs, track budget utilization, and cut cycle time from weeks to days.
- Headcount Scenario Planning: Model hiring plans against live budget thresholds. Finance and People Ops work from the same data, so headcount decisions never outpace financial reality.
- Headcount Requests & Approvals: Standardize new hire requests with embedded rationale, budget context, and dynamic approval routing synced to your ATS and finance systems.
- AI Agent: Ask natural language questions about comp gaps, attrition risk, and headcount forecasts. Get analyst-grade answers in seconds, not spreadsheet-hours.
For lean HR teams managing hundreds of employees across distributed US locations, this is the difference between estimating workforce quality and actually measuring it.
The companies scaling fastest in 2026 are not the ones with the most HR data. They are the ones measuring the right workforce quality metrics consistently, in a connected and unified system. If that is where you want to be, CandorIQ was built for exactly this. Book your demo today.

FAQs
Q. How do you measure workforce quality effectively?
Start with compensation band adherence, regrettable attrition rate, and headcount plan vs. actuals. These three metrics give you a baseline view of pay governance, retention risk, and planning accuracy. Build from there as your data maturity improves.
Q. What is a good benchmark for workforce quality?
Compensation band adherence above 90%, regrettable attrition below 25% of total turnover, and headcount plan variance within 10–15% are strong starting benchmarks for mid-sized US companies.
Q. What tools track workforce quality metrics best?
The most effective tools connect compensation data, headcount planning, and approval workflows in a single platform. Platforms like CandorIQ are built specifically for this, giving HR and Finance teams shared visibility into comp bands, cycle completion, and headcount actuals in real time.
Q. How is workforce quality different from workforce productivity?
Productivity measures output. Quality measures the structural conditions that make sustainable output possible, fair pay, clear bands, internal mobility, and planning alignment.
Q. Why do HR and Finance disagree on workforce data?
Because they usually maintain separate systems with different update cadences. Finance updates headcount models monthly. HR updates comp records after each cycle. The gap between those timelines is where misalignment lives.
Ready to modernize your workforce and compensation strategy?
See how CandorIQ brings workforce planning and compensation together with AI.