Workforce Analytics: Examples, Benefits, and Best Practices
Learn how Work Analytics helps you predict attrition, plan headcount, manage compensation, improve workforce decisions, examples, benefits, and best practices.

Workforce Analytics often feels like trying to understand a busy city from inside a single building. You see activity everywhere, but you do not always know what is happening or where attention is needed. Why do some teams stay fully staffed while others lose people faster? Why does one department exceed goals while another struggles with overtime and burnout? These patterns matter because people's decisions shape performance, budgets, and long-term stability.
Many companies still rely on guesswork, scattered data, or delayed reports when they try to understand what is happening inside their workforce. A simple metric, like rising absenteeism or slower hiring, can signal bigger issues ahead. When you can catch these signals early, you avoid costly surprises and keep your teams focused.
This blog helps you explore Workforce Analytics from a practical point of view, so you can see how it supports clear decisions and steady growth.
Key Takeaways
- Work Analytics gives companies a clear view of staffing, performance, and budgeting patterns.
- It helps predict attrition, optimize headcount, and maintain fair compensation decisions.
- Accurate data and connected HR–Finance systems are essential for reliable insights.
- Predictive analytics strengthens planning by showing risks and future workforce outcomes early.
- Platforms like CandorIQ simplify workforce analytics by unifying compensation, hiring, and headcount data in one place.
Understanding Workforce Analytics
Work Analytics helps companies understand how their teams operate, perform, and change over time. It gives a clearer view of staffing, performance trends, and early warning signs that may affect budgets or output. Many organizations use it to improve planning and avoid guesswork.
To understand how Work Analytics functions, here are the essential points that define its role across teams and departments.
- Team performance tracking: Shows patterns in output, productivity, and engagement across groups.
- Staffing visibility: Highlights gaps, workload pressure, and upcoming needs before issues rise.
- Behavior patterns: Reflects turnover risks, attendance shifts, and efficiency changes.
- Resource alignment: Connects people's decisions with budgeting and planning needs.
Key Components of Workforce Analytics
Work Analytics brings several core data points together so companies can understand how people decisions affect finances and workflow. These components allow leaders to see beyond basic reports and gain a full picture of workforce behavior. When combined, they support more accurate planning.
Below are the main elements that shape effective Work Analytics and help organizations build reliable workforce insights.
- Employee data: Includes roles, tenure, performance, and movement trends.
- Financial data: Connects compensation, budget usage, and burn rate patterns.
- Hiring data: Tracks pipeline speed, offer acceptance, and hiring timelines.
- Planning inputs: Supports headcount targets, staffing models, and scenario planning.
This foundation sets the stage for practical scenarios, showing how workforce analytics solves real challenges across teams.
Workforce Analytics Examples
Work Analytics helps companies understand patterns inside their teams so they can plan smarter and avoid unnecessary surprises. It brings together hiring data, performance trends, and financial signals to create clearer decisions. These examples show how organizations use Work Analytics to strengthen productivity and budgeting without relying on guesswork.
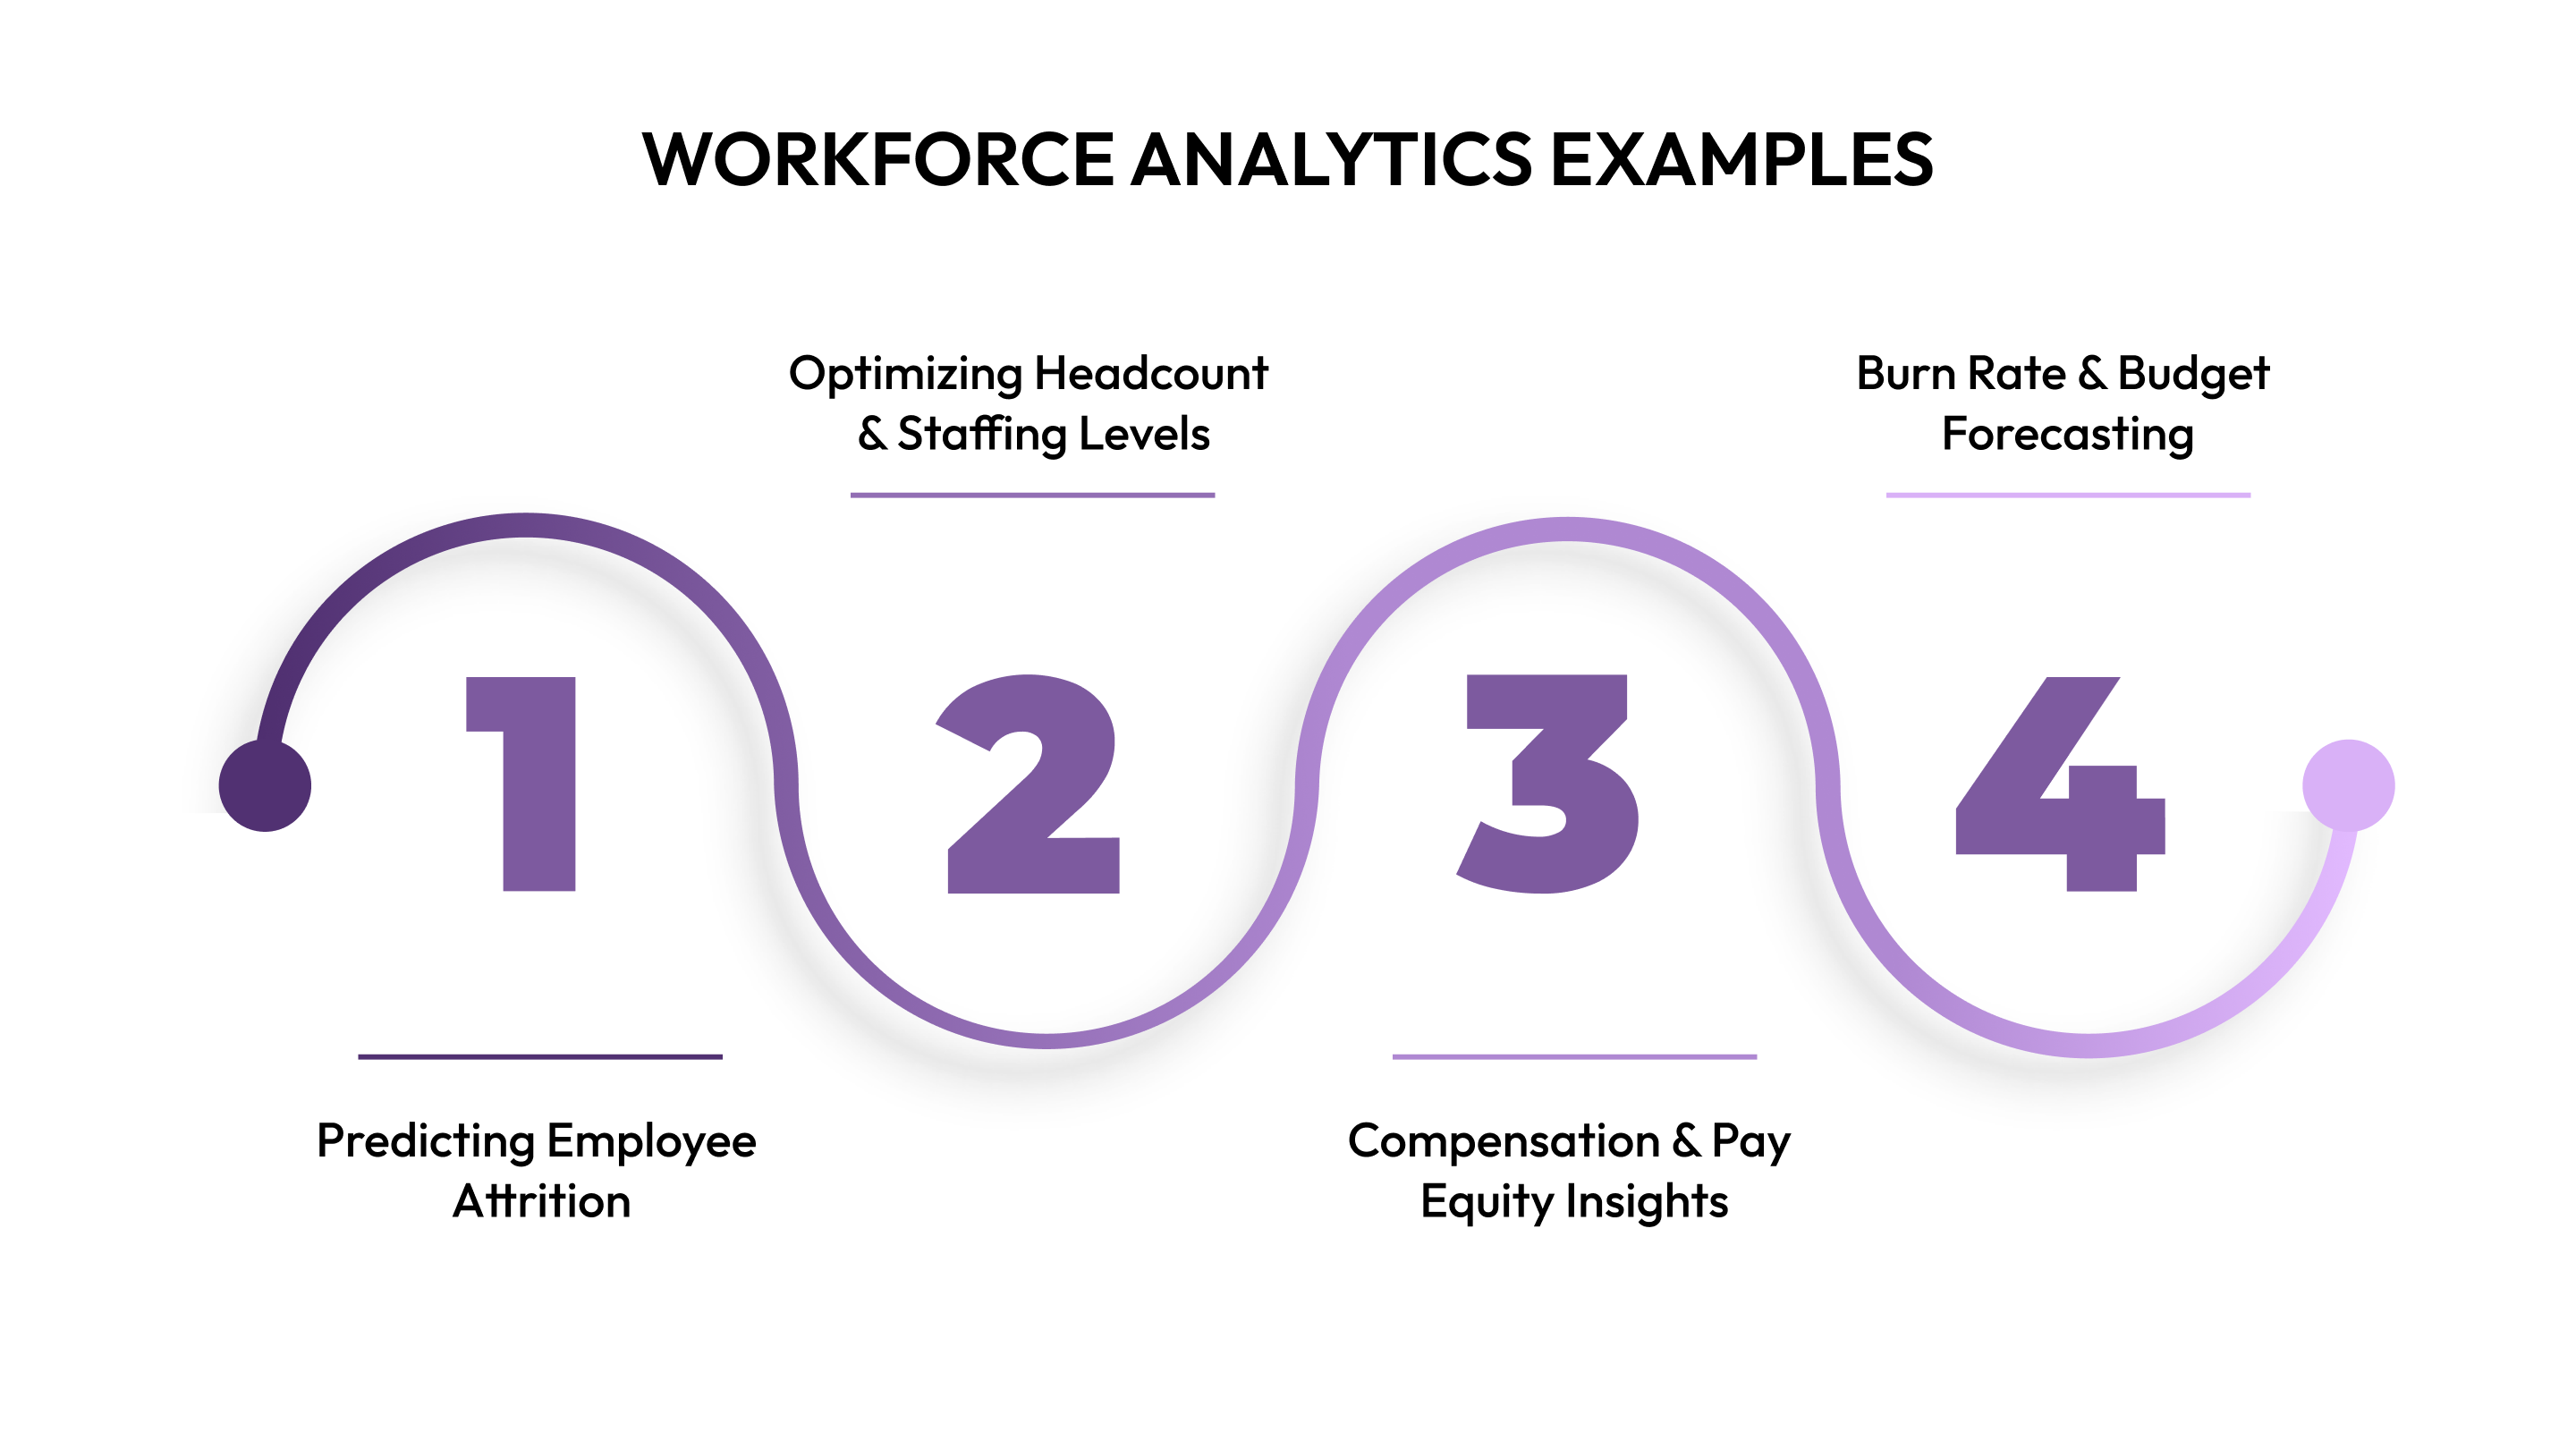
To make these examples easier to follow, here are four clear use cases that show how Work Analytics supports daily operations.
Predicting Employee Attrition
Work Analytics helps identify early signs that employees may be considering leaving. Patterns in attendance, performance shifts, and engagement changes reveal hidden risks. This gives leaders time to respond before turnover affects productivity.
Below are key ways Work Analytics highlights possible attrition signals so teams can act before issues grow larger.
- Absence spikes: Flags rising absenteeism patterns linked to disengagement.
- Performance drops: Shows consistent declines that may signal dissatisfaction.
- Short tenure clusters: Points to roles with frequent early exits.
- Feedback patterns: Highlights recurring concerns in surveys or comments.
Optimizing Headcount & Staffing Levels
Work Analytics helps leaders understand whether teams are overstaffed, understaffed, or stretched during peak periods. It highlights workload shifts, project demands, and hiring slowdowns. This helps companies plan staffing with fewer delays and fewer budget surprises.
Here are the main staffing insights Work Analytics provides to support smoother scheduling and resource planning.
- Workload balancing: Shows teams carrying heavier or lighter loads than expected.
- Peak season signals: Predicts when staffing increases may be required.
- Role-specific gaps: Identify positions delaying projects or slowing operations.
- Hiring timeline visibility: Reveals how recruitment speed affects coverage.
Compensation & Pay Equity Insights
Work Analytics shows how compensation compares across teams, roles, and tenure groups. It helps identify pay gaps, outdated bands, and budgeting pressures before they create compliance issues. These insights support fair and consistent compensation decisions.
Here are the most common pay-related patterns Work Analytics brings forward to support balanced and fair compensation planning.
- Pay gap checks: Highlights inconsistencies across similar roles or tenures.
- Band alignment: Shows where salaries fall outside established ranges.
- Raise patterns: Tracks historical raise decisions and budget impact.
- Compensation drift: Reveals when market rates move faster than internal updates.
Burn Rate & Budget Forecasting
Work Analytics connects headcount changes, hiring plans, and compensation data to show how fast teams use their budget. It helps leaders see future spending patterns and avoid overruns. This creates more stability during planning cycles.
Here are the main financial insights Work Analytics provides to help companies maintain stable spending across quarters.
- Monthly burn tracking: Shows how staffing costs move each month.
- Scenario impact: Predicts how hiring or raises affect annual budgets.
- Overrun alerts: Flags line items rising faster than planned.
- Budget pacing: Tracks how current spending aligns with yearly targets.
Also Read: The AI-Powered Evolution of Total Rewards
These examples highlight how workforce analytics works in real situations, creating a natural shift toward the benefits it delivers.
Benefits of Workforce Analytics
Work Analytics helps companies understand patterns that are often missed when data lives in separate systems. It supports better decisions by connecting headcount, compensation, performance, and financial signals in one place. This gives leaders a clearer view of how people's decisions affect budgets and long-term plans.
To help you see how Work Analytics strengthens daily operations and strategy, here are the key benefits explained in simple points.
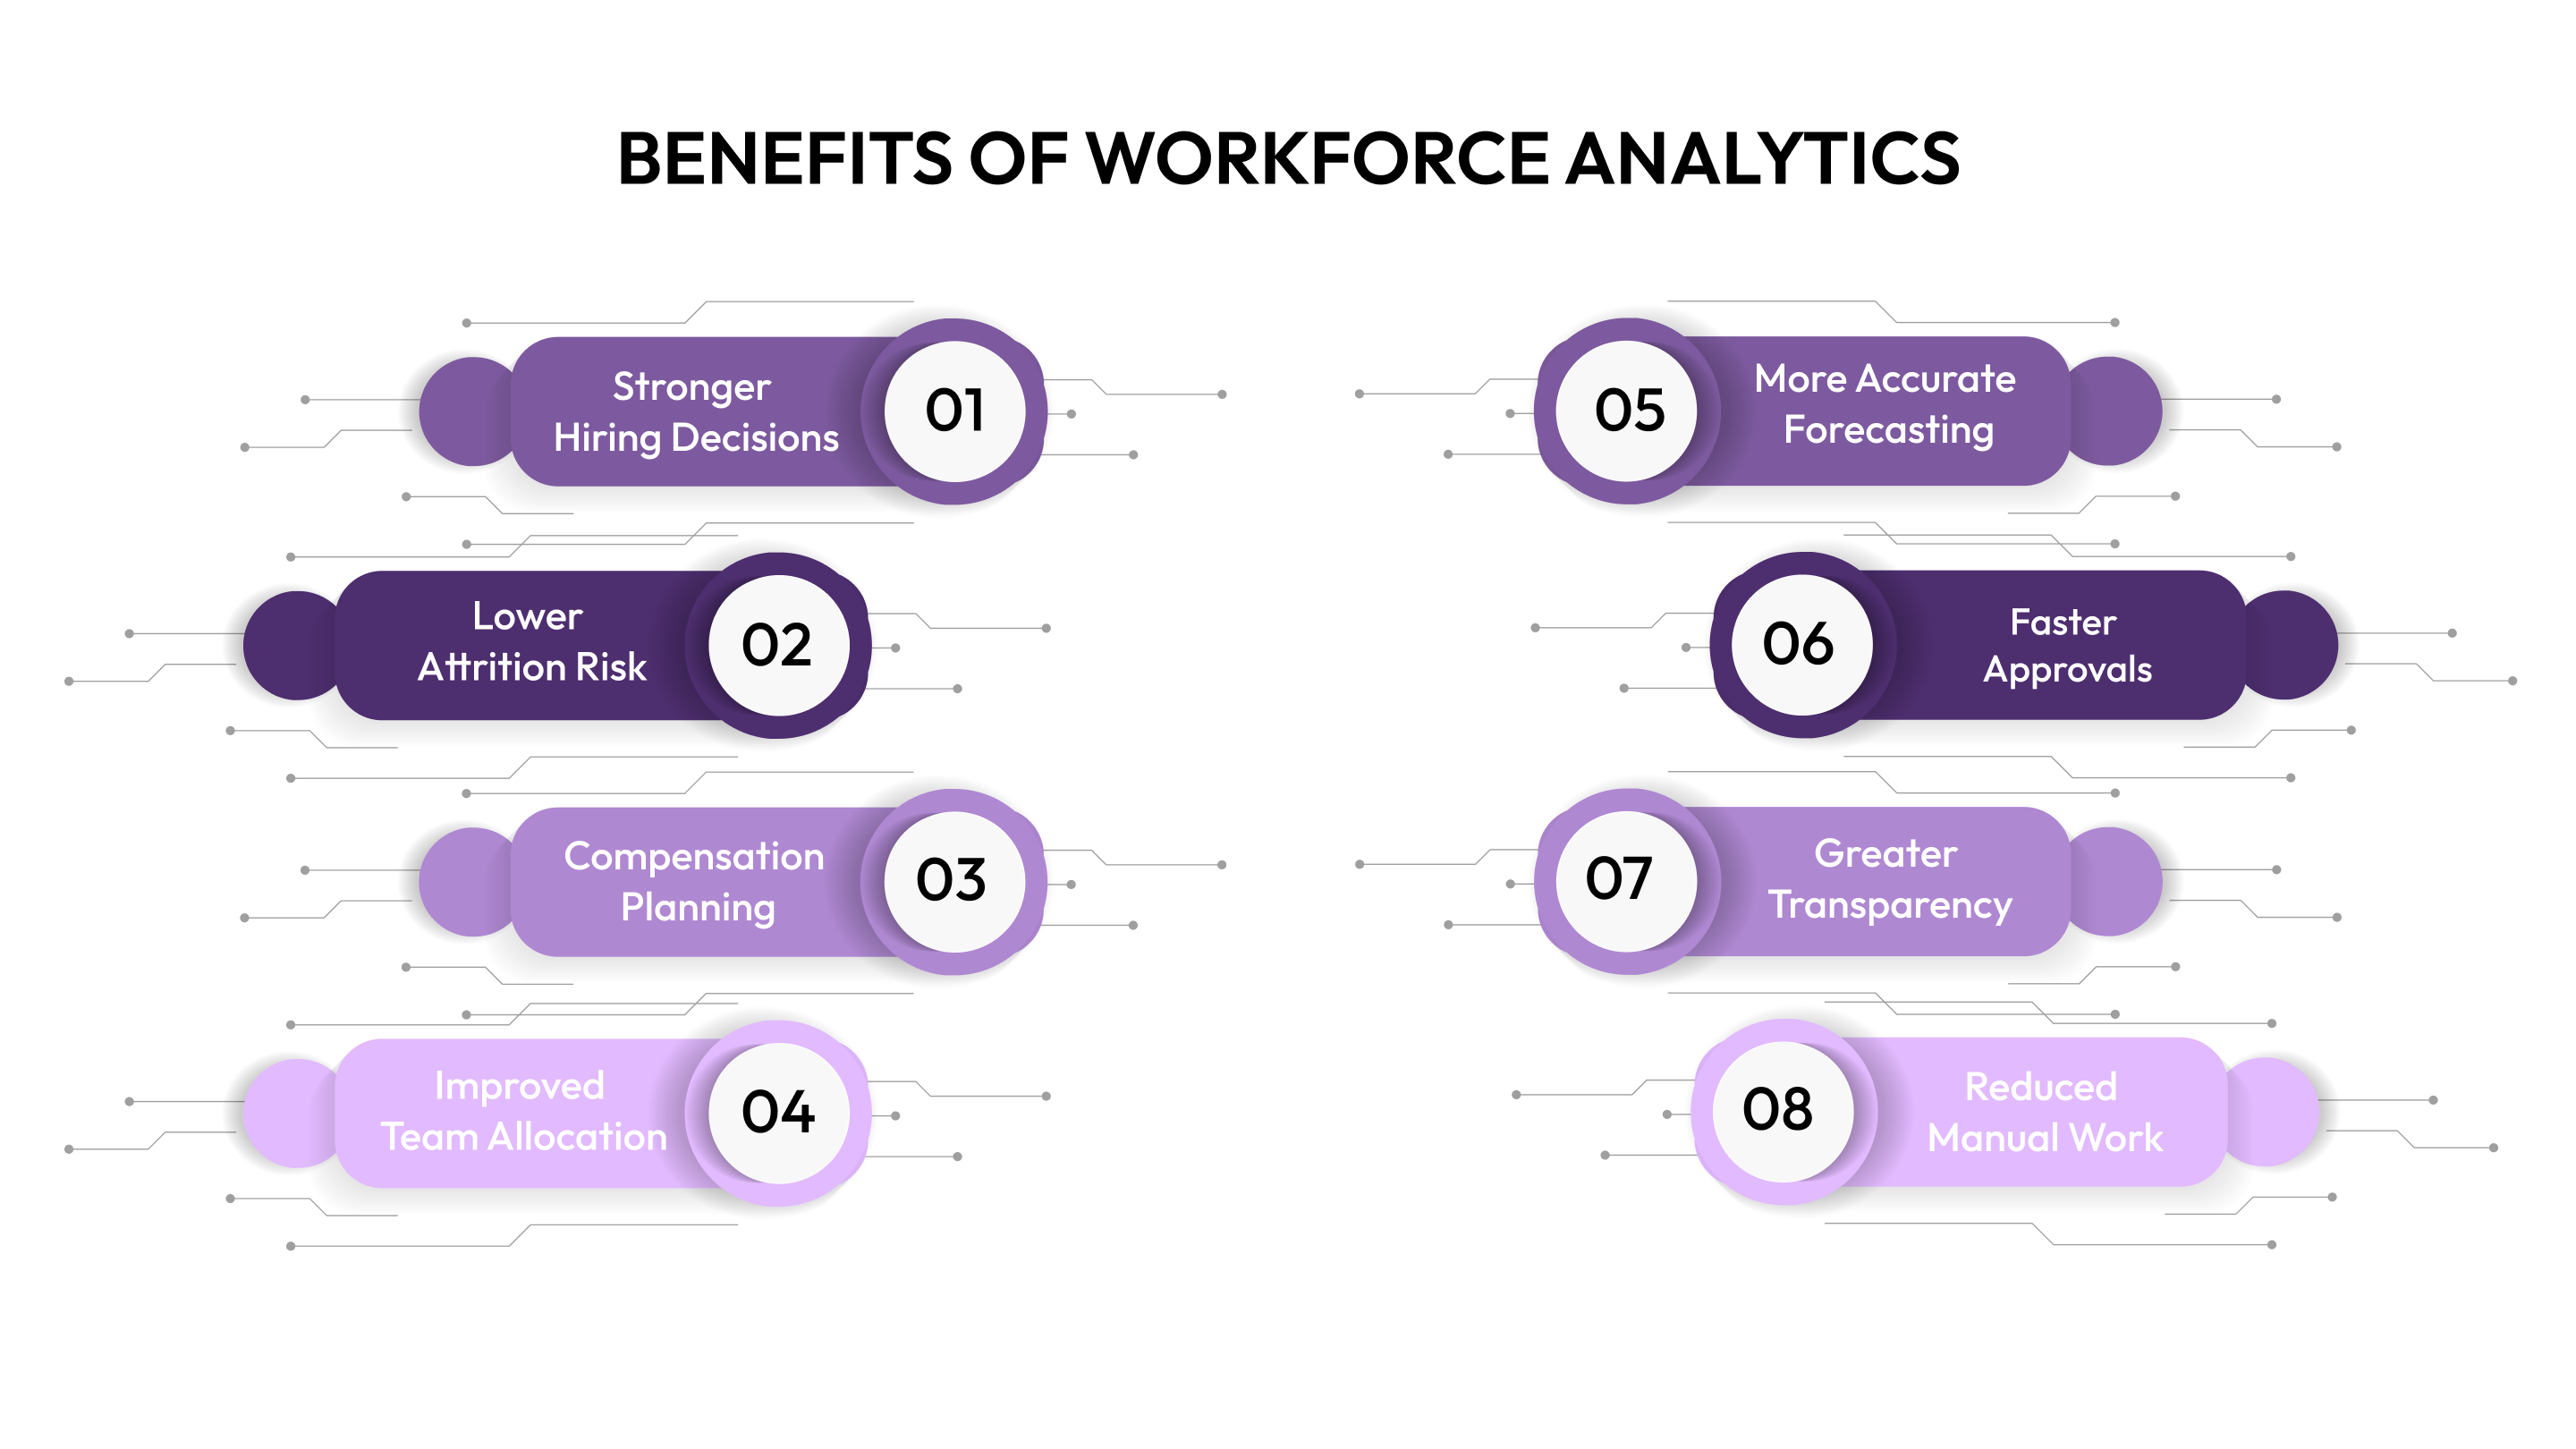
- Stronger hiring decisions: Shows which roles are most needed now and which can be delayed to protect the budget.
- Lower attrition risk: Identifies turnover patterns early so teams can respond before productivity drops.
- Better compensation planning: Highlights pay gaps, outdated ranges, and raises impact on future budgets.
- Improved team allocation: Reveals overstaffed or understaffed areas so resources match the actual workload.
- More accurate forecasting: Connects hiring plans and pay decisions to create steadier monthly and annual projections.
- Faster approvals: Reduces back-and-forth by giving HR and Finance the same source of truth.
- Greater transparency: Helps leaders explain decisions more clearly with data instead of assumptions.
- Reduced manual work: Cuts time spent merging spreadsheets, tracking changes, or fixing version conflicts.
Also Read: Understanding Employee Compensation: Beyond Just Salary
Understanding the benefits of workforce analytics helps teams see why following best practices is essential for consistent and effective results.
Best Practices for Workforce Analytics
Work Analytics only delivers strong results when a company follows structured habits and consistent processes. Many teams collect plenty of data but do not convert it into action because they lack a clear starting point. This section helps you understand the practices that make workforce insights accurate, practical, and easy to use across HR and Finance.
To make each best practice easier to apply, here are simple explanations grouped under key subtopics.
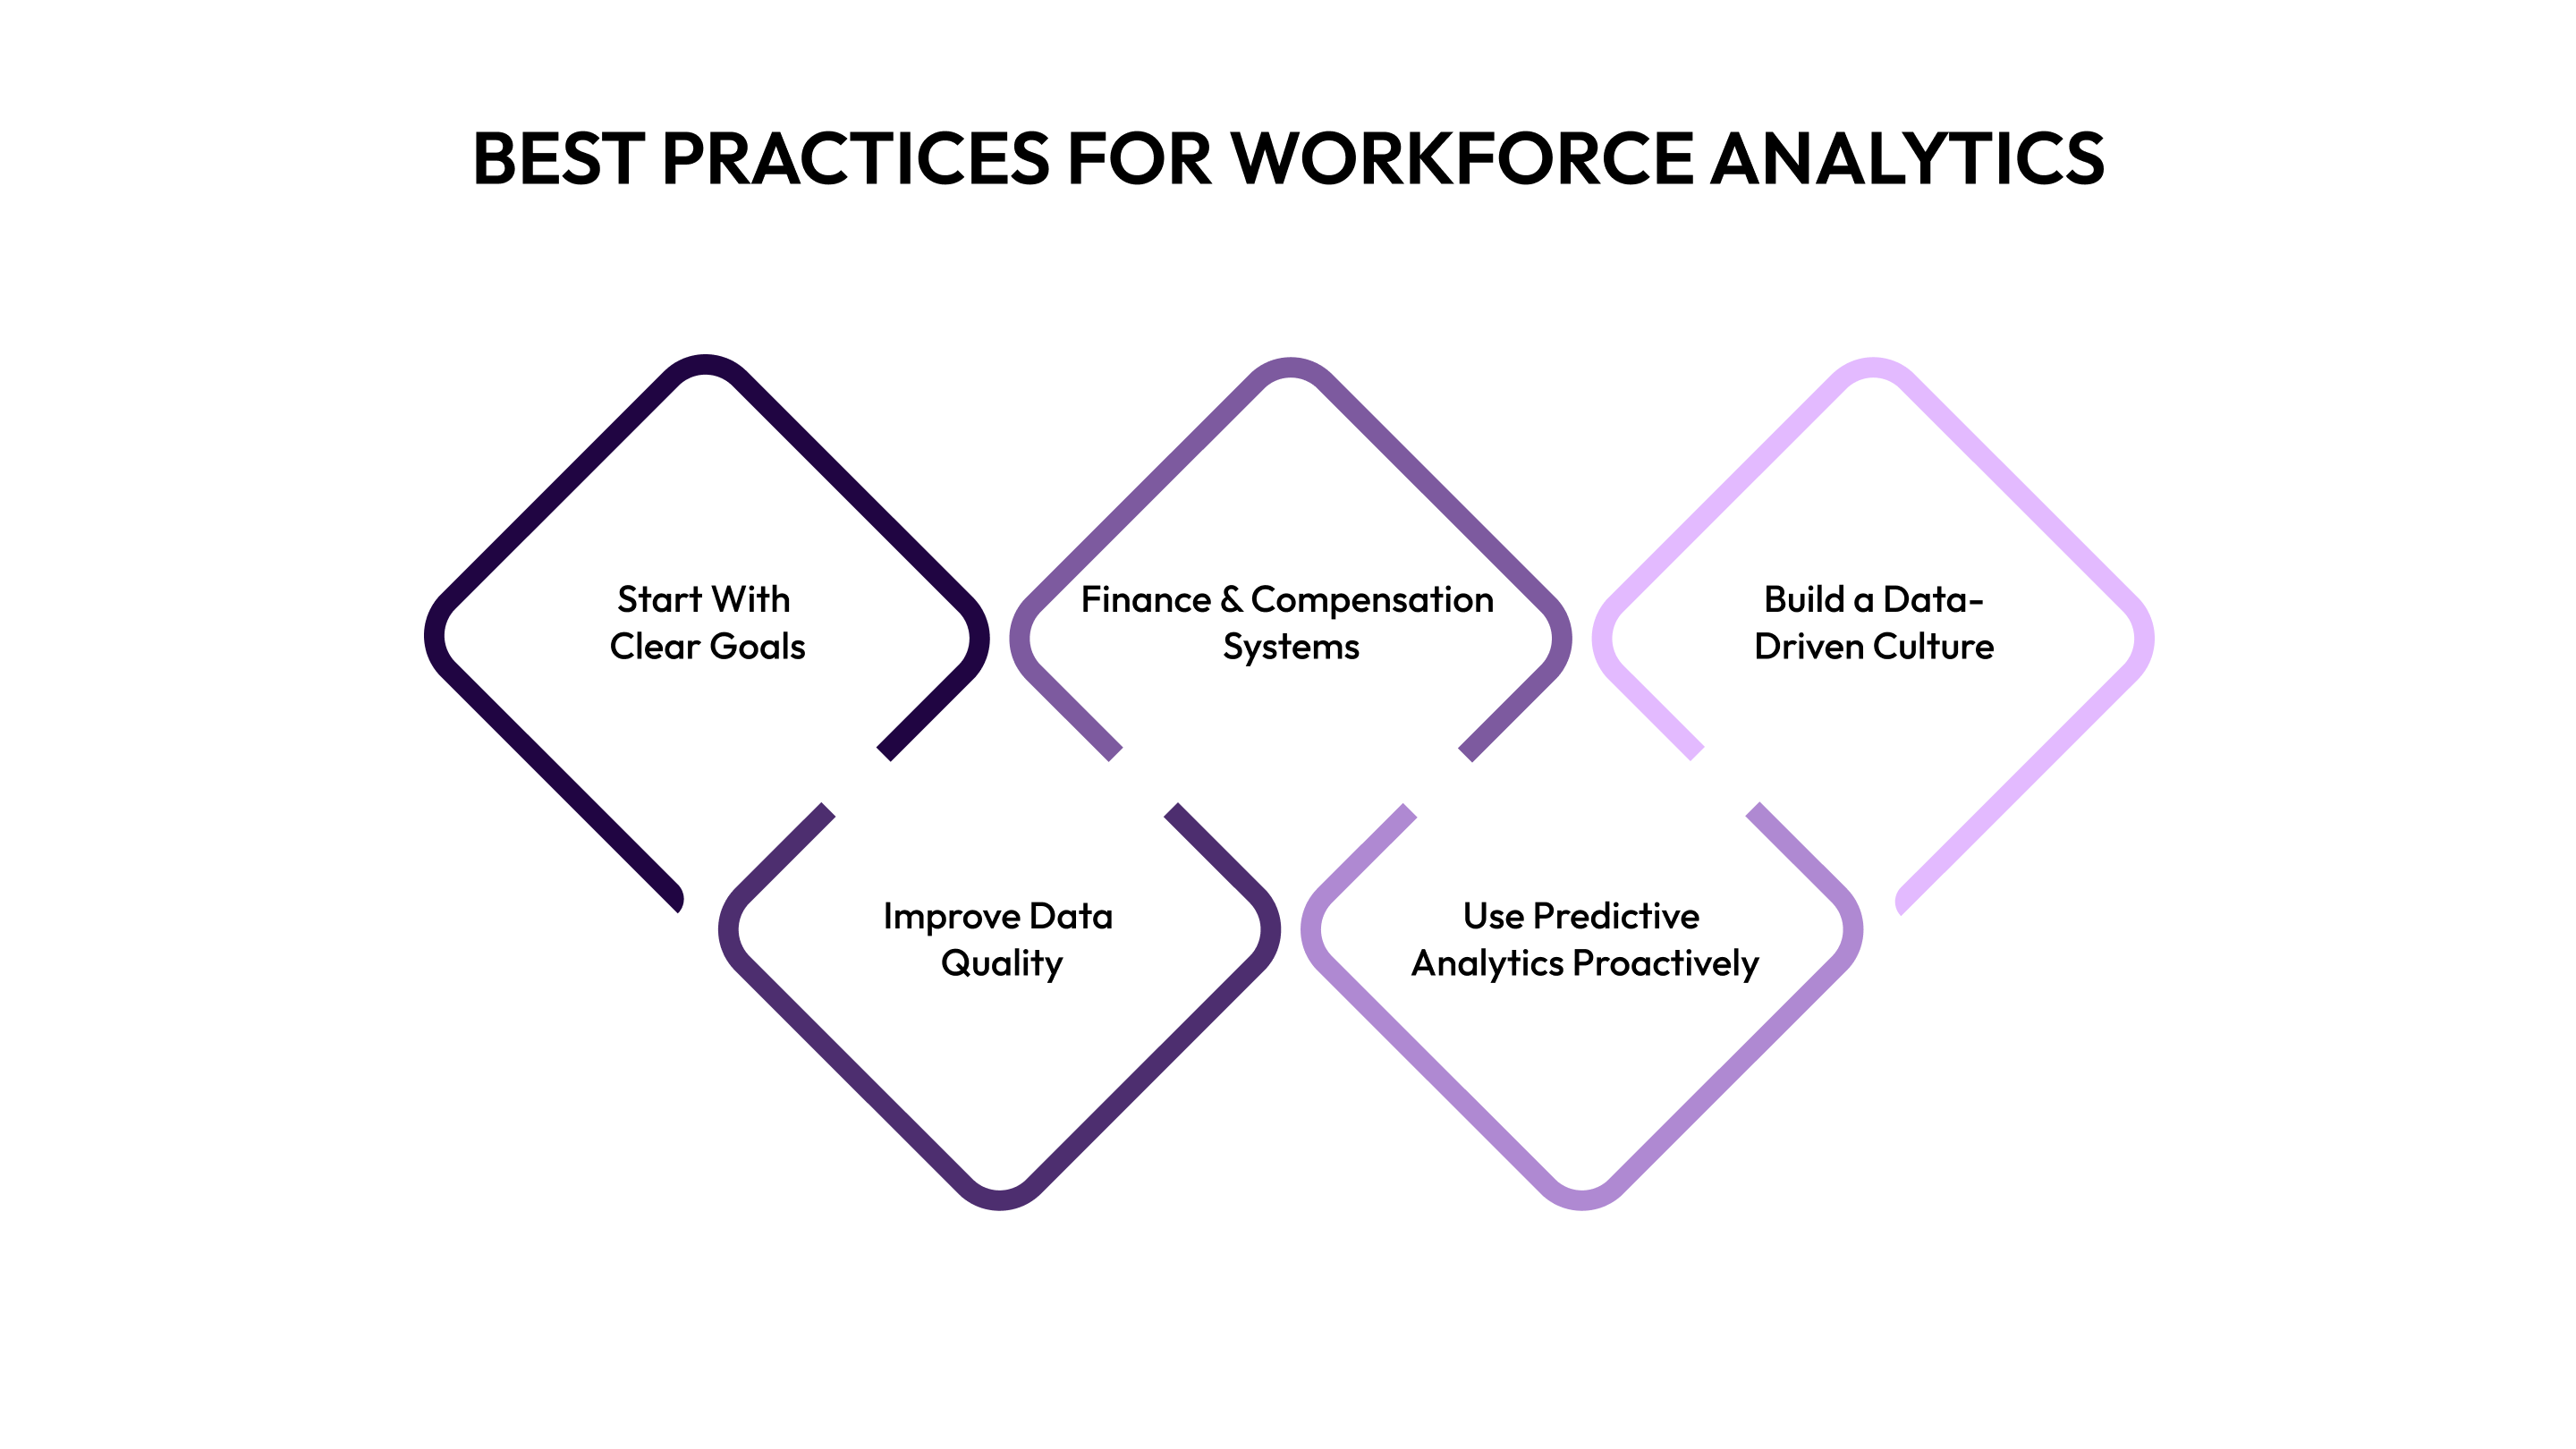
Start With Clear Goals
Most teams jump into Work Analytics without deciding what they want to fix first, which leads to scattered insights. Clear goals help you focus on the decisions that matter most, whether it is improving retention or managing headcount more responsibly.
Here’s what goal-setting looks like when applied to workforce planning and compensation.
- Pick one main problem first: Helps teams avoid spreading attention across too many metrics early on.
- Define success in numbers: Let's HR and Finance track progress using measurable targets instead of assumptions.
- Align with budget timelines: Ensures analytics work supports planning cycles and leadership reviews.
Improve Data Quality
Work Analytics becomes confusing when teams work with outdated job titles, incomplete pay data, or inconsistent org charts. High-quality inputs ensure every insight is reliable enough to support important hiring or compensation decisions.
To support cleaner and more dependable data, here are simple habits to follow.
- Standardize naming rules: Reduces confusion from duplicate or mismatched job titles used across teams.
- Update data at fixed intervals: Keeps headcount, pay, and hiring status accurate for reporting.
- Remove duplicates quickly: Prevents errors that affect metrics, ratios, and projections.
Integrate HR, Finance & Compensation Systems
When systems don’t communicate, Work Analytics becomes slow, manual, and error-prone. A connected workflow allows HR, Finance, Recruiting, and Leadership to rely on the same numbers during reviews and discussions.
To support seamless integration across departments, keep these practices in mind.
- Connect core platforms: Keeps HRIS, ATS, and compensation data aligned at all times.
- Automate data syncing: Reduces manual updates and avoids version drift during planning cycles.
- Use shared dashboards: Helps teams base decisions on identical metrics and definitions.
Use Predictive Analytics Proactively
Predictive insights are most helpful when used before issues grow into larger problems. When applied proactively, Work Analytics can prevent hiring delays, pay compression, and sudden attrition spikes.
To get better value from predictive models, follow these simple actions.
- Check risk indicators regularly: Helps teams spot early warnings related to turnover or budget strain.
- Test multiple scenarios: Shows how hiring or pay decisions affect future outcomes.
- Review past predictions: Improves accuracy as teams compare expectations with real results.
Build a Data-Driven Culture
Work Analytics works best when every team understands and uses insights in their daily decisions. A data-driven approach encourages openness, better conversations, and stronger planning outcomes across the organization.
These steps help teams build comfort and confidence around data.
- Share simplified dashboards: Makes insights easier for non-technical users to understand.
- Explain the “why” behind insights: Encourages trust and better adoption across teams.
- Promote open discussions: Helps HR and Finance align before sharing recommendations with leadership.
These best practices set the foundation for stronger planning, which leads directly into the challenges companies often face when applying workforce analytics.
Challenges and Solutions in Workforce Analytics
Workforce analytics often looks simple on the surface, yet many teams face the same hurdles when they try to apply it every day. You may recognize issues like scattered data, unclear metrics, or difficulty turning numbers into actions. These challenges slow adoption and limit the value companies can get from work analytics.
Below are the key challenges and paired solutions that help you apply work analytics effectively without slowing down your daily operations.
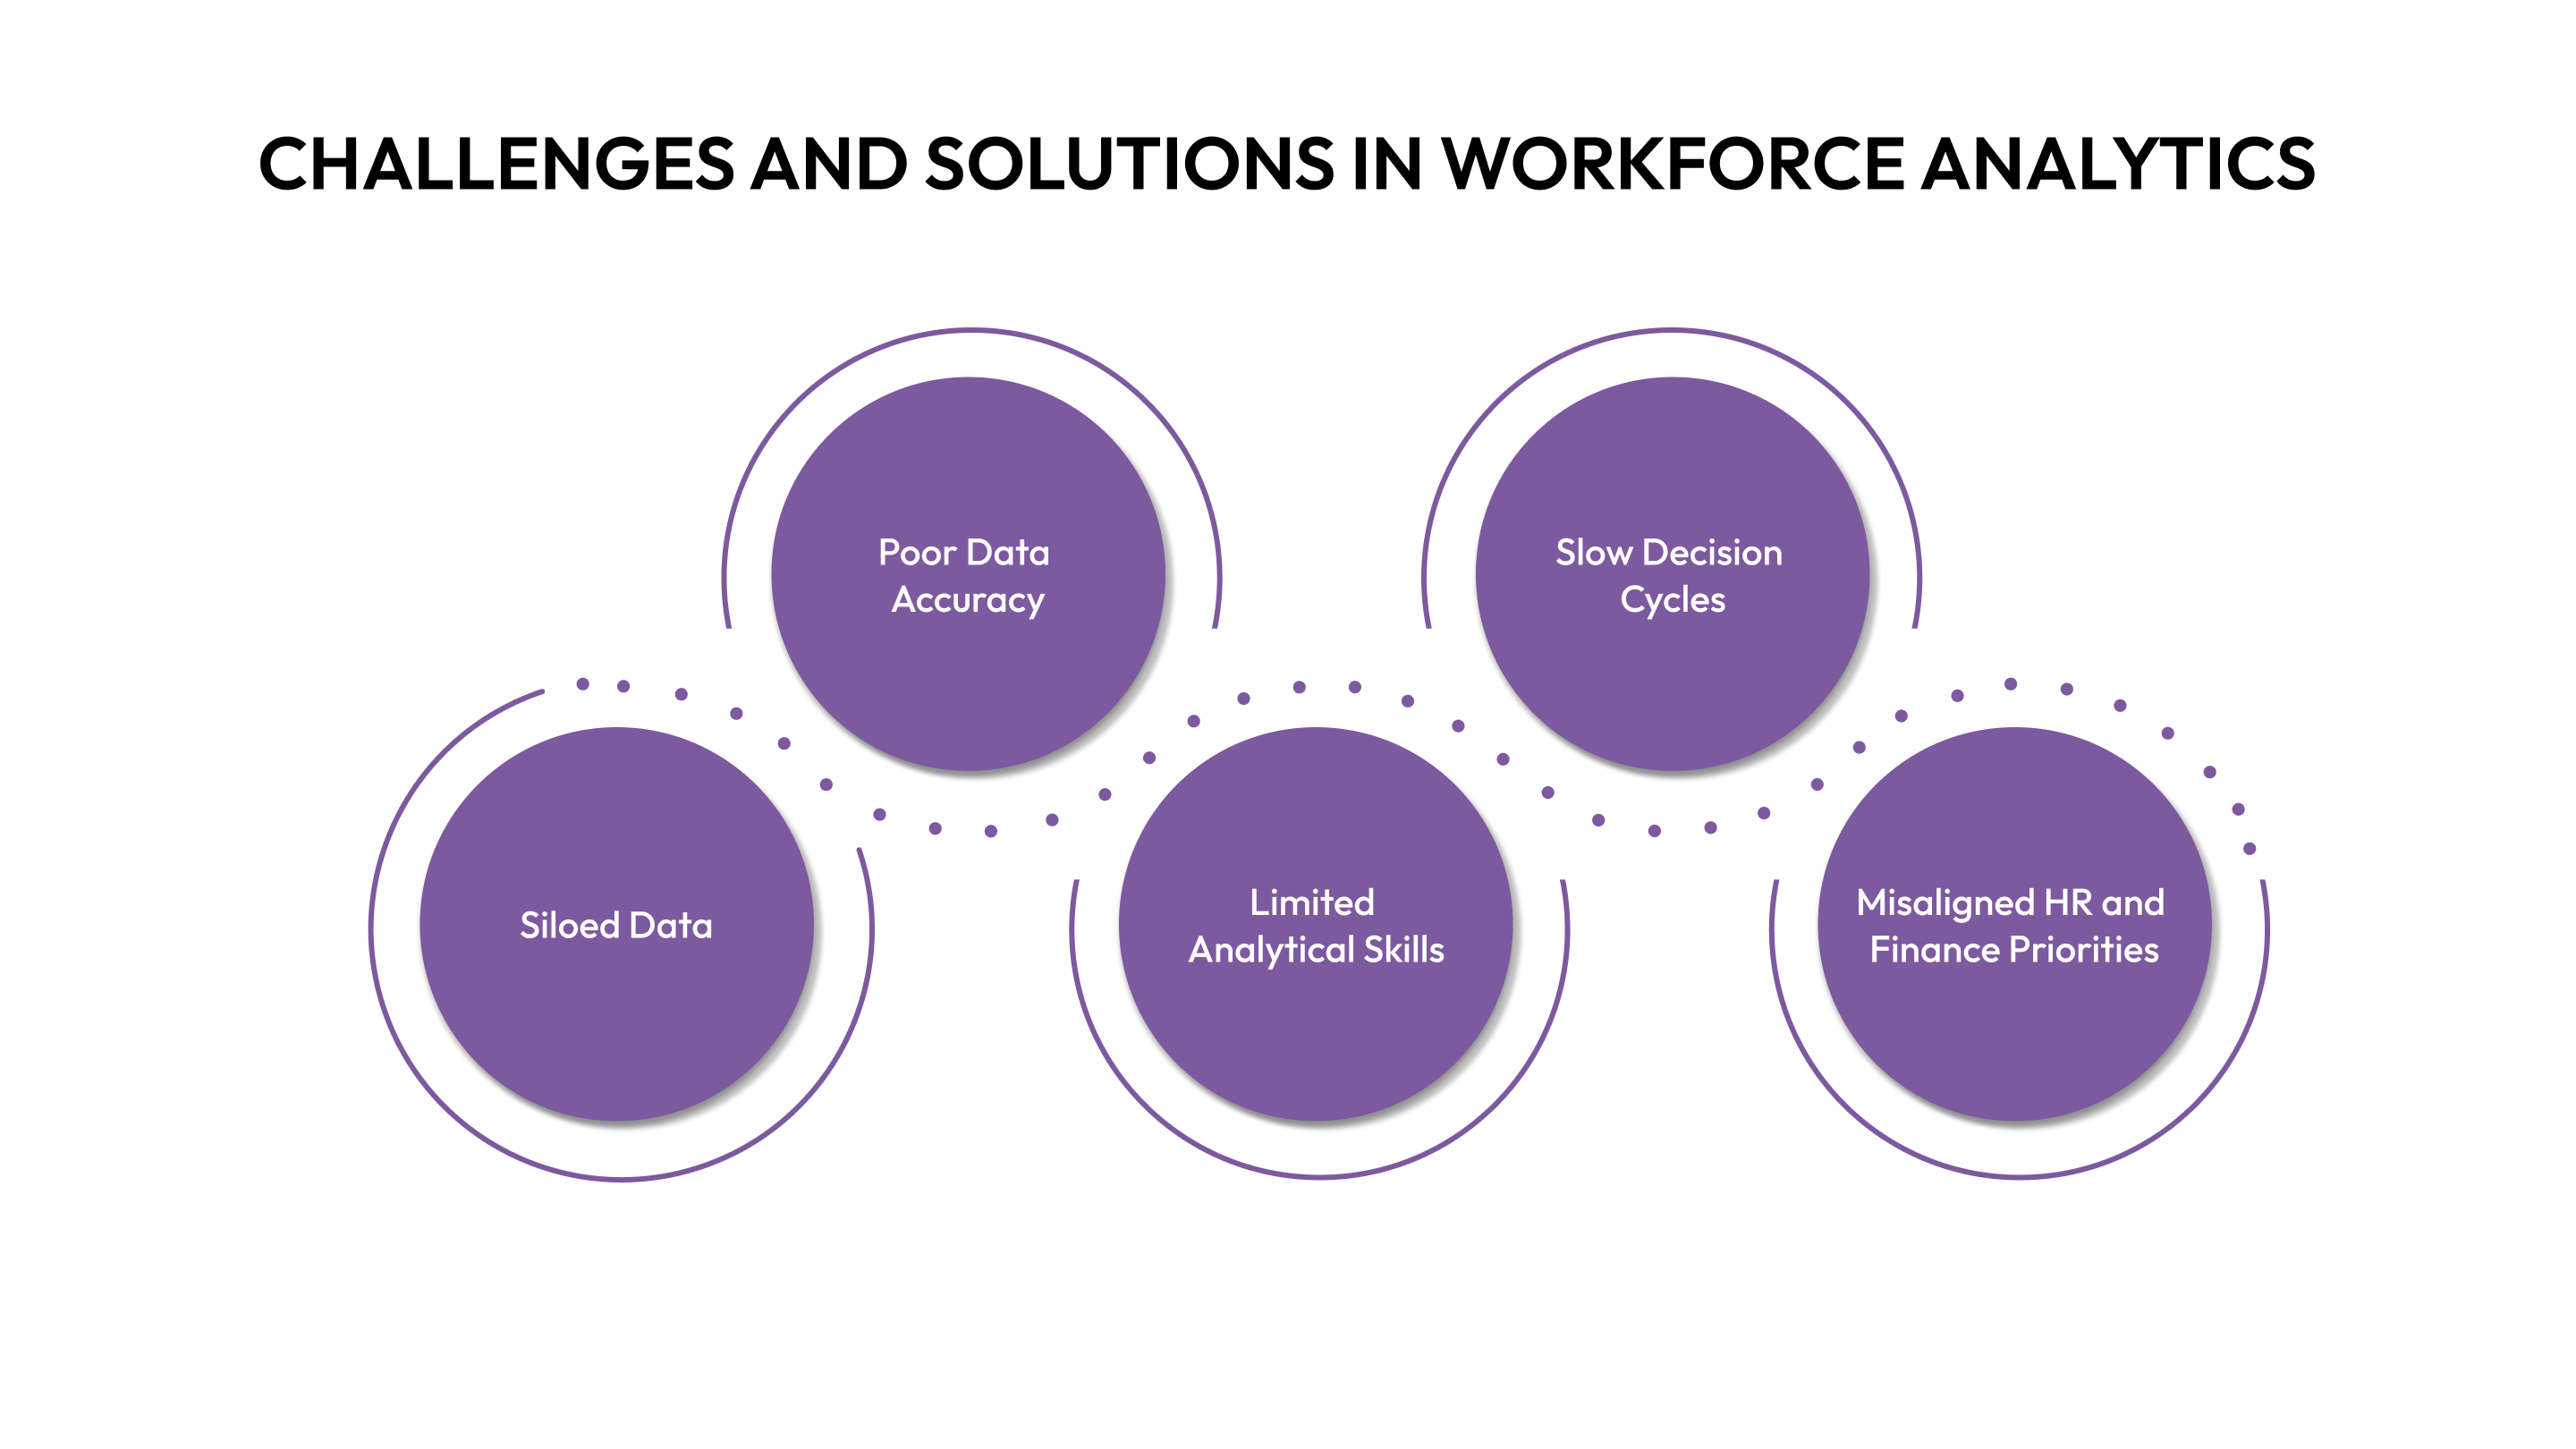
- Challenge: Siloed Data
- Solution: Connect HR, Finance, and talent systems to give teams a single and consistent work analytics source.
- Solution: Connect HR, Finance, and talent systems to give teams a single and consistent work analytics source.
- Challenge: Poor Data Accuracy
- Solution: Set update rules and auto-validation checks to strengthen the reliability of every work analytics report.
- Solution: Set update rules and auto-validation checks to strengthen the reliability of every work analytics report.
- Challenge: Limited Analytical Skills
- Solution: Give teams simple dashboards and guided insights so they can use work analytics without being data experts.
- Solution: Give teams simple dashboards and guided insights so they can use work analytics without being data experts.
- Challenge: Slow Decision Cycles
- Solution: Use automated alerts and forecasting tools to speed up budget reviews, staffing decisions, and hiring approvals.
- Solution: Use automated alerts and forecasting tools to speed up budget reviews, staffing decisions, and hiring approvals.
- Challenge: Misaligned HR and Finance Priorities
- Solution: Build shared goals and cross-team visibility to ensure work analytics supports decisions for both budget and people needs.
Also Read: From EOY Wins to 2026 Momentum: Insights from Top People Leaders
These challenges highlight why teams need simple starting steps, which make the move into workforce analytics smoother and more manageable.
Tips to Get Started With Workforce Analytics
Getting started with work analytics becomes easier when you begin with simple steps and build consistency over time. Many teams think they need perfect data or advanced models, but small actions can already improve visibility and decision quality. These tips help you create a solid starting point without overwhelming your team.
Here are practical steps you can use to bring work analytics into your daily planning and reporting.
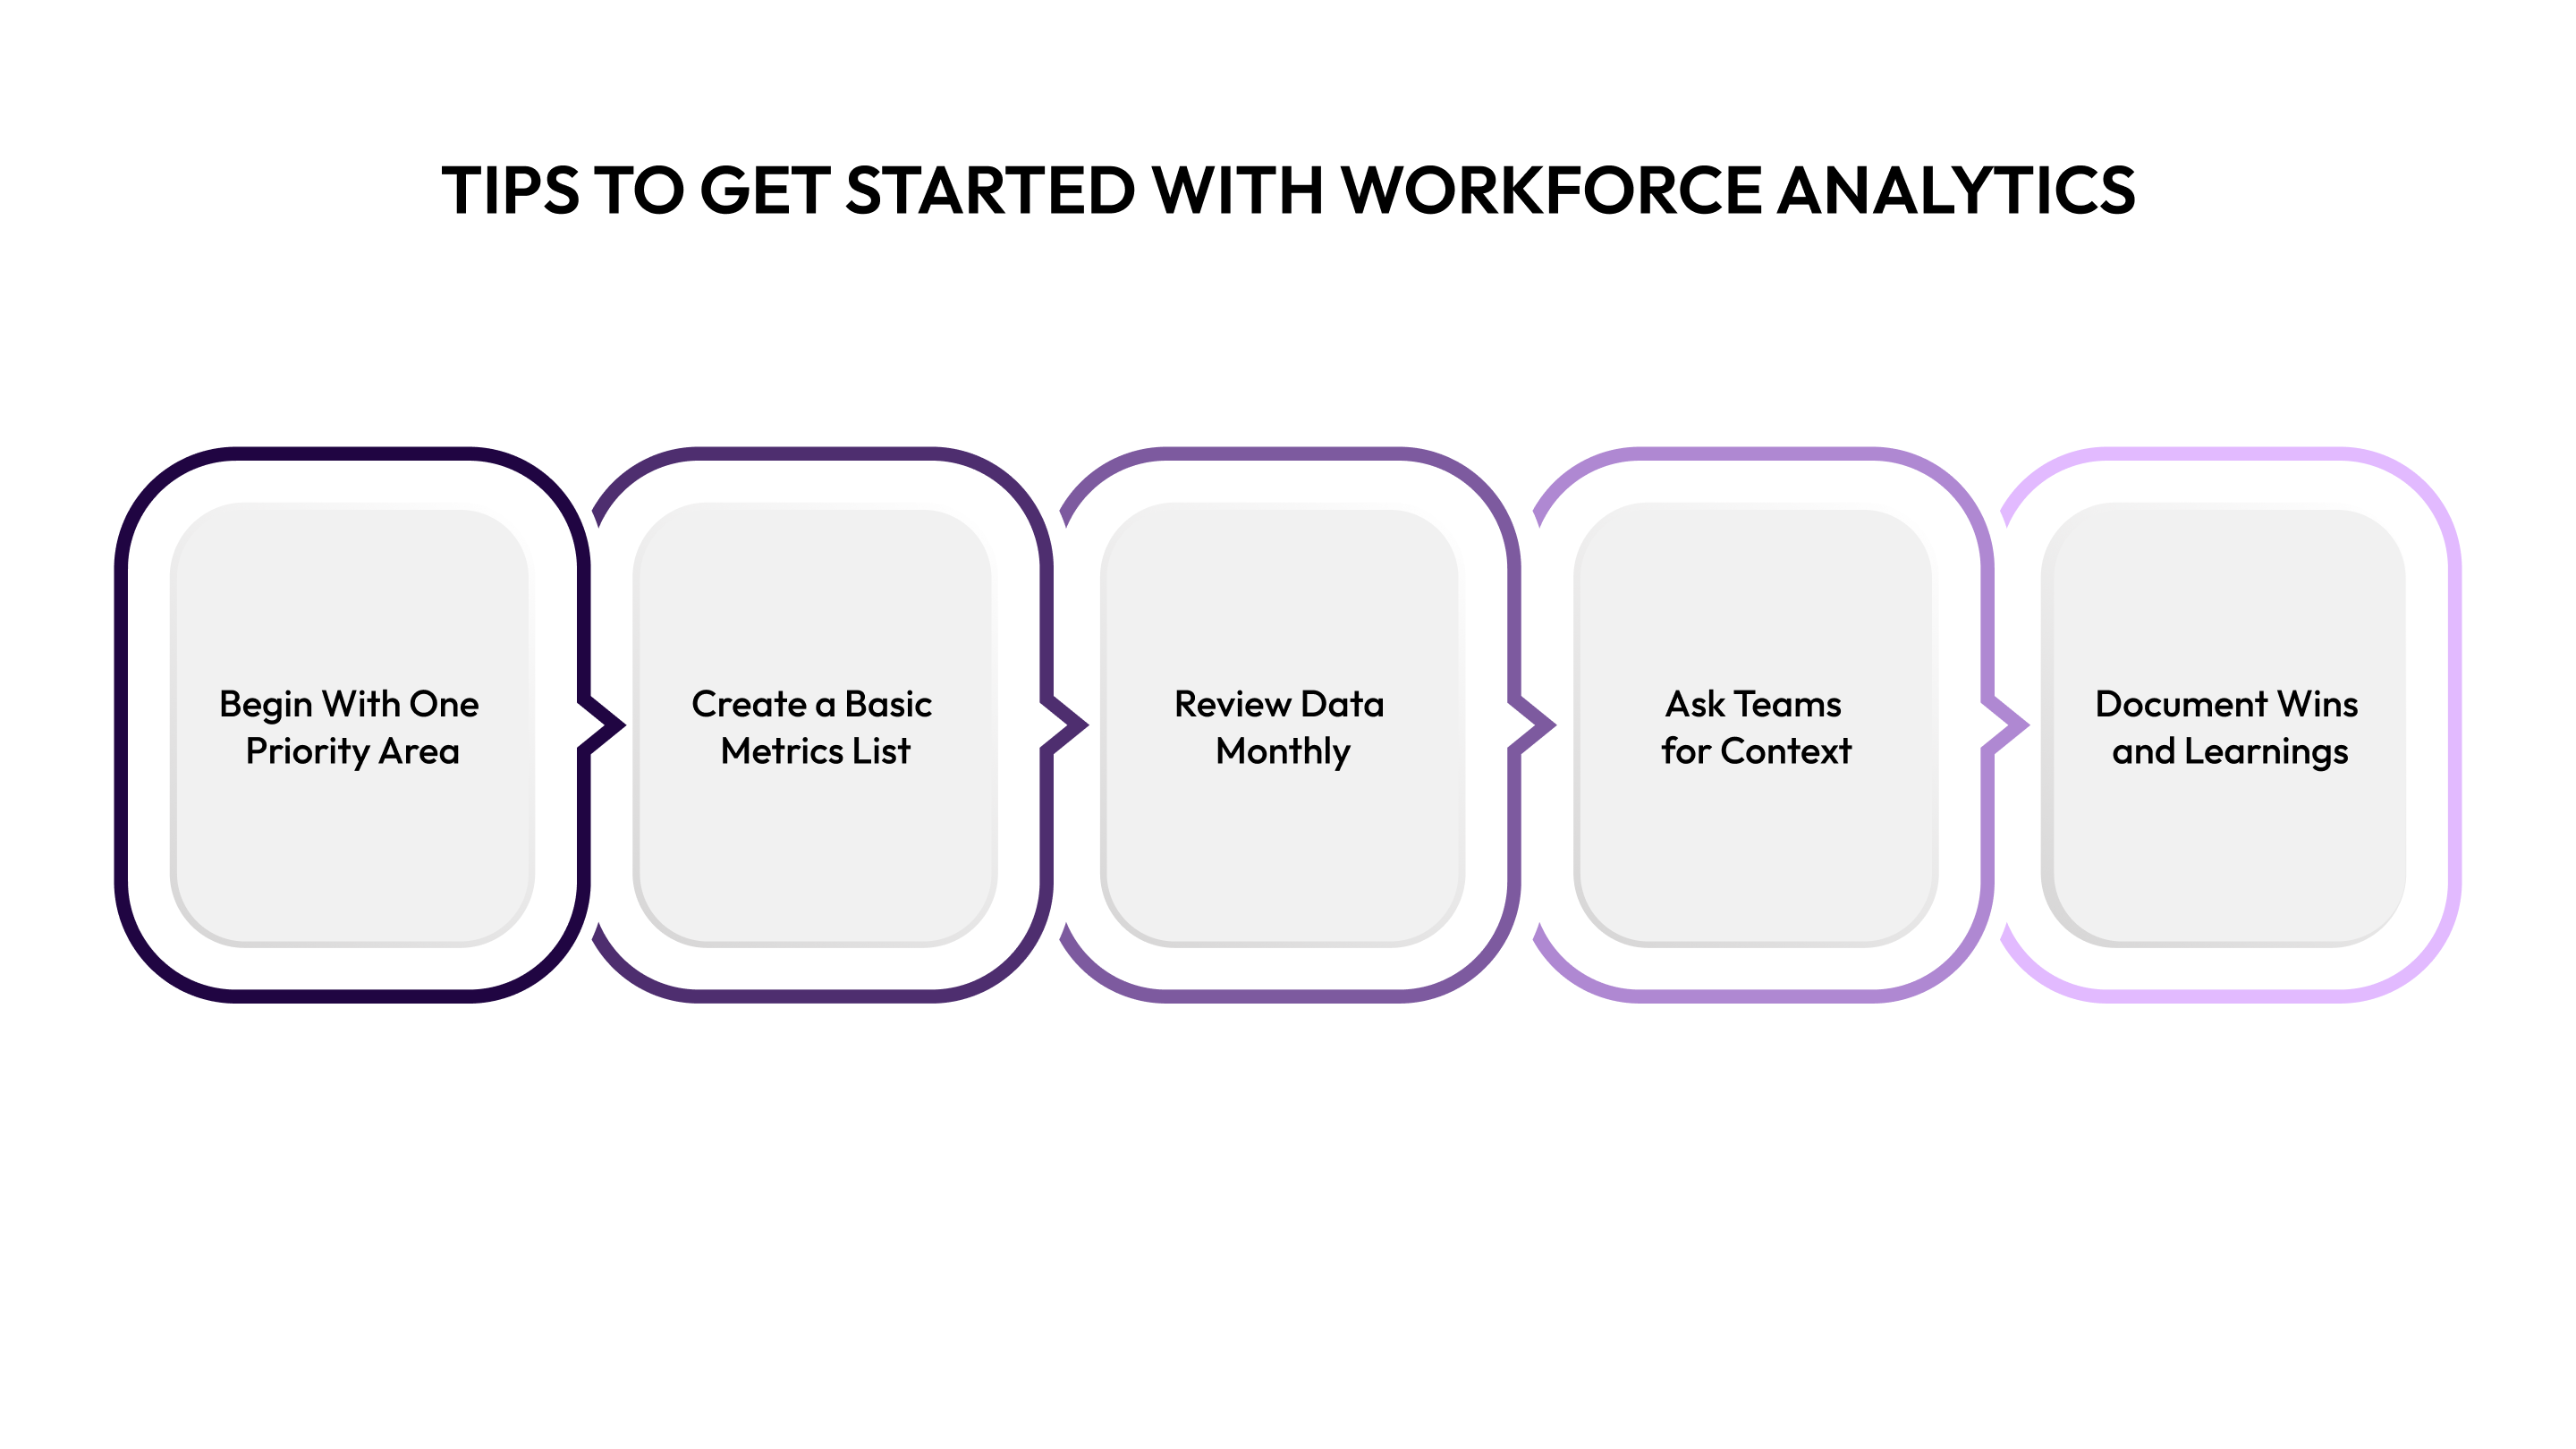
- Begin With One Priority Area: Focus on a single goal, like reducing attrition or improving hiring speed, to introduce work analytics gradually.
- Create a Basic Metrics List: Track core metrics such as headcount, compensation, turnover, and hiring pace to build early clarity.
- Review Data Monthly: Set a consistent review cycle so work analytics becomes part of your normal planning rhythm.
- Ask Teams for Context: Combine numbers with manager feedback to strengthen the meaning of every work analytics insight.
- Document Wins and Learnings: Keep a simple record of improvements to show teams the value of using work analytics regularly.
These practical tips show the basics, while CandorIQ provides tools to make workforce analytics faster, clearer, and more actionable.
How CandorIQ Helps With Workforce Analytics
CandorIQ gives teams a clear and practical way to use work analytics across compensation, headcount planning, and workforce management. Instead of scattered files or disconnected reports, you get one system that shows how your people decisions affect budgets, staffing, and long-term growth. This helps HR, Finance, and leadership stay aligned without extra effort.
Below are the ways CandorIQ’s products strengthen work analytics and make daily decisions faster and easier.
- Compensation & Payband Builder: Supports consistent pay ranges and geo adjustments so work analytics reflects accurate and structured compensation data.
- Compensation Cycle: Automates merit and bonus reviews, improving work analytics by keeping all decision records in one place.
- Headcount Scenario Planning: Shows multiple hiring outcomes, helping you compare work analytics scenarios based on budget, hiring pace, and team needs.
- Candidate Offers: Centralizes salary, equity compensation, and benefits details to improve offer accuracy and strengthen compensation-related work analytics.
- Workforce Management Dashboard: Tracks attrition, filled roles, open seats, and staffing changes so work analytics stays updated daily.
- AI Agent for Insights: Provides recommendations and quick answers, helping non-technical teams use work analytics without complex analysis.
By demonstrating how CandorIQ supports work analytics, it becomes clear why these insights are essential for smarter, data-driven decisions.

Conclusion
Work analytics gives HR and Finance teams the clarity they need to plan, budget, and support employees with confidence. When you can see patterns in attrition, compensation, staffing needs, or budget usage, decisions become simpler and more predictable. This matters even more for fast-growing organizations, where small gaps in planning can quickly turn into bigger challenges.
By using structured data, clear processes, and connected systems, you can turn work analytics into a daily advantage rather than a one-time project. Platforms like CandorIQ make this shift easier by bringing compensation, headcount planning, and workforce insights into one place. When your team has the right information at the right time, you can build a workforce strategy that supports growth, fairness, and long-term stability.
Want clearer insights across headcount, budgets, and compensation? Schedule a CandorIQ book demo and explore what unified work analytics can do for your team.
FAQs
1. How do companies start collecting data for workforce analytics?
Most start with HRIS, ATS, and payroll data because they already hold employee and financial records. Connecting these systems builds a clear base for analysis. A single source of truth makes the process smoother.
2. Can workforce analytics improve employee retention?
Yes, it helps identify early signs of disengagement or rising turnover risks. Teams can act quickly with better communication, recognition, or revised compensation plans. This supports long-term stability.
3. What are common metrics tracked in workforce analytics?
Companies typically track hiring speed, turnover rates, staffing ratios, pay ranges, and capacity needs. These metrics show where teams might be understaffed or overspending. They guide more accurate planning.
4. Is workforce analytics useful during budget cuts?
Yes, it helps leaders see the impact of different cost-saving choices before acting. Teams can plan changes without harming critical roles or long-term growth. This allows smarter financial decisions.
5. Can workforce analytics improve collaboration between HR and Finance?
It creates shared visibility into staffing, budgets, and compensation data, reducing back-and-forth requests. Both teams work from the same information, which cuts delays and confusion. This leads to faster and more aligned decisions.
Ready to modernize your workforce and compensation strategy?
See how CandorIQ brings workforce planning and compensation together with AI.