How to Master Headcount Trend Analysis for Smarter Workforce Planning
Learn how to run headcount trend analysis that connects workforce data to compensation costs, budget variance, and retention risk.

Is your headcount data telling you what's actually happening in your workforce? Presently, one-third of organizations lack real-time workforce data to make confident headcount decisions. That gap is costly.
When your HR, Finance, and leadership work off different numbers, hiring plans fall apart and budgets break down mid-year. The root problem is the absence of ongoing headcount trend analysis.
This guide covers how to build that analysis, which headcount usage metrics matter most, and how to turn workforce data into decisions your CFO and CPO can stand behind.
Key Takeaways
- Headcount trend analysis tracks workforce changes over time, by department, level, and location, to surface hiring, attrition, and cost patterns before they become problems.
- The most valuable headcount usage metrics go beyond turnover rate. They connect workforce size to compensation cost, offer acceptance trends, and budget variance.
- HR and Finance teams often operate from different headcount numbers. Bridging that gap, with shared definitions and a unified data model, is the single highest-leverage fix for mid-market companies.
- Distributed U.S. teams need geo-aware headcount analysis. A hire in Austin and a hire in New York at the same title carry very different costs and compliance implications.
- CandorIQ connects headcount planning, compensation data, and scenario modeling in one platform, so People teams and Finance teams always work from the same numbers.
What Is Headcount Trend Analysis?
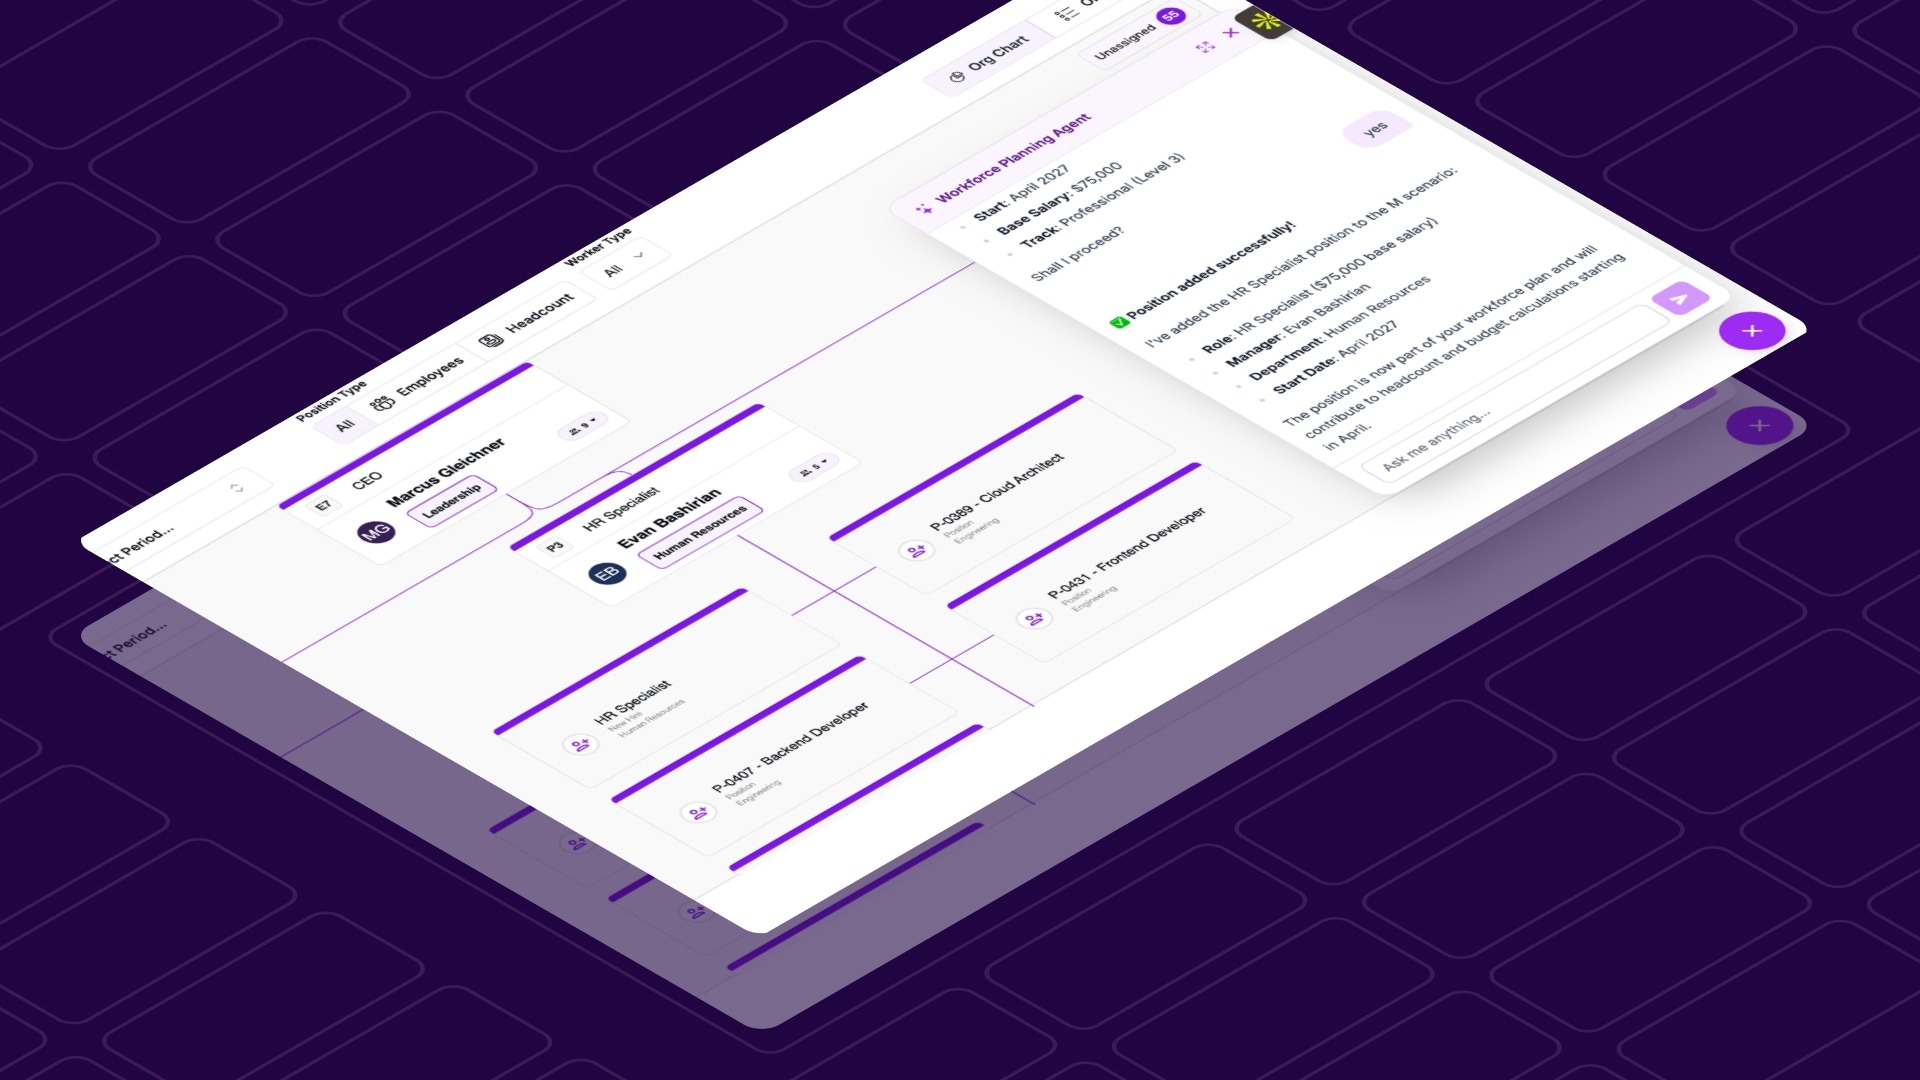
Headcount trend analysis is the practice of tracking how your workforce size changes over time, across departments, levels, and locations. Unlike a one-time headcount report, trend analysis is continuous.
.png)
Headcount Analysis vs. Workforce Planning
These two terms get used interchangeably, but they're not the same thing. Headcount analysis tells you what happened. Workforce planning tells you what you need.
The most effective organizations run both and connect them. Your analysis feeds your planning, and your planning shapes what you track.
Headcount vs. FTE: What's the Difference?
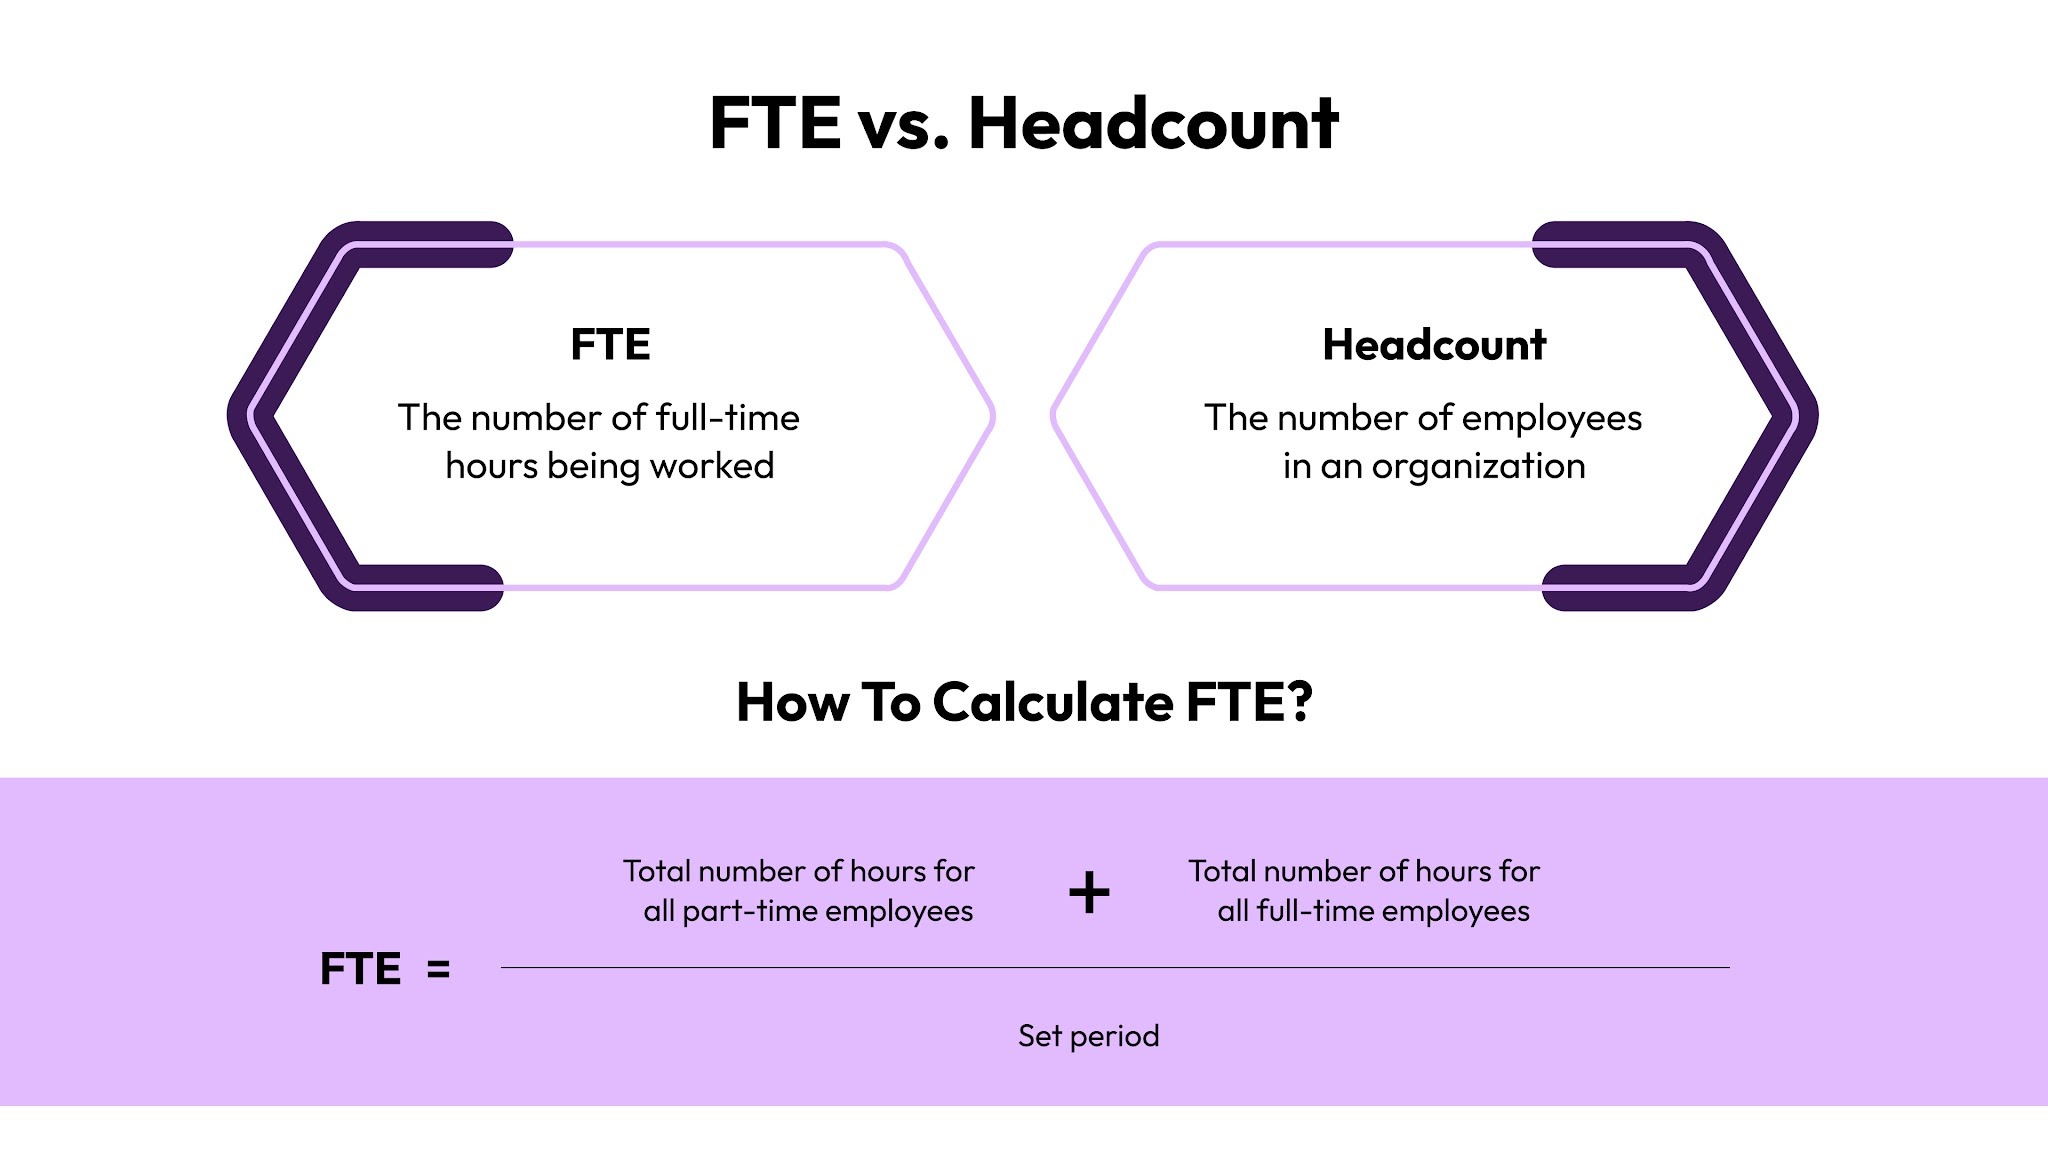
Headcount counts people. FTE (full-time equivalent) counts capacity. A part-time employee working 20 hours is counted as 1 headcount but 0.5 FTE. For companies with contractors, part-timers, or employees across multiple U.S. states, this distinction matters enormously.
Now that you understand what headcount trend analysis actually is, let's look at why tracking it consistently changes how your business makes decisions.
Benefits of Tracking Headcount Trends
Tracking headcount trends is a strategic advantage. Here's what consistent analysis gives you:
- You Catch Attrition Before It's A Crisis: Trend data reveals when a department is quietly shrinking. If engineering has lost five people in three months and you only review headcount quarterly, you're already behind. Ongoing tracking surfaces that pattern early.
- You Can Defend Your Budget To Finance: When HR and Finance both pull headcount from different systems, you spend time reconciling numbers instead of making decisions. Trend data from a single source ends that conversation.
- You See The True Cost of Hiring: Adding five people in Q2 doesn't just add five salaries. It adds benefits, load, equity grants, signing bonuses, and recruiting fees. Headcount trend analysis connected to compensation data shows the full picture, not just a headcount number.
- You Make Mid-Year Reforecasts With Confidence: Business conditions change. When they do, you need to reforecast headcount fast. A team with strong trend data can quickly model three scenarios.
Now, let’s understand which metrics to track to make the analysis actionable.
6 Headcount Usage Metrics That Actually Drive Enterprise Decisions
Most companies track turnover rate and time-to-fill. But they are table stakes. Here are the six headcount usage metrics that scaling U.S. enterprise teams actually run decisions on.
- Net Headcount Growth Rate: Gross hires minus gross exits, tracked monthly by department and level. FP&A uses this to measure hiring velocity against the annual plan.
- Annualized Comp Cost Per Headcount: Salary plus benefits load (~18–22%), payroll taxes, and equity, geo-adjusted by U.S. metro. It lets CFOs model labor cost as a percentage of revenue.
- Headcount Variance: Plan Vs. Actual: The gap between the approved headcount budget and actual hires by cost center. It is the most-requested metric in every mid-year reforecast cycle.
- Voluntary Vs. Involuntary Attrition By Tenure: Separates voluntary exits from PIPs and layoffs, segmented by 0–1 year, 1–3 years, and 3+ years. It reveals onboarding failures vs. development gaps.
- Offer Acceptance Rate Trend: A leading indicator of pay competitiveness. If acceptance rates are dropping, you're losing headcount before it's ever gained. It connects recruiting data to comp benchmarks.
- Manager Span Of Control: How many direct reports each manager carries over time. Over-stretched managers burn out and leave, and manager attrition is among the most expensive talent events a company faces.
Also Read: Top HR Metrics to Track for Success
Knowing which metrics to track is step one. Step two is building the process to analyze them consistently.
How to Run a Headcount Trend Analysis
A headcount trend analysis is most useful when it's a repeatable process, not a one-off project. Here's how scaling enterprise teams builds that process across HR, Finance, and Recruiting.
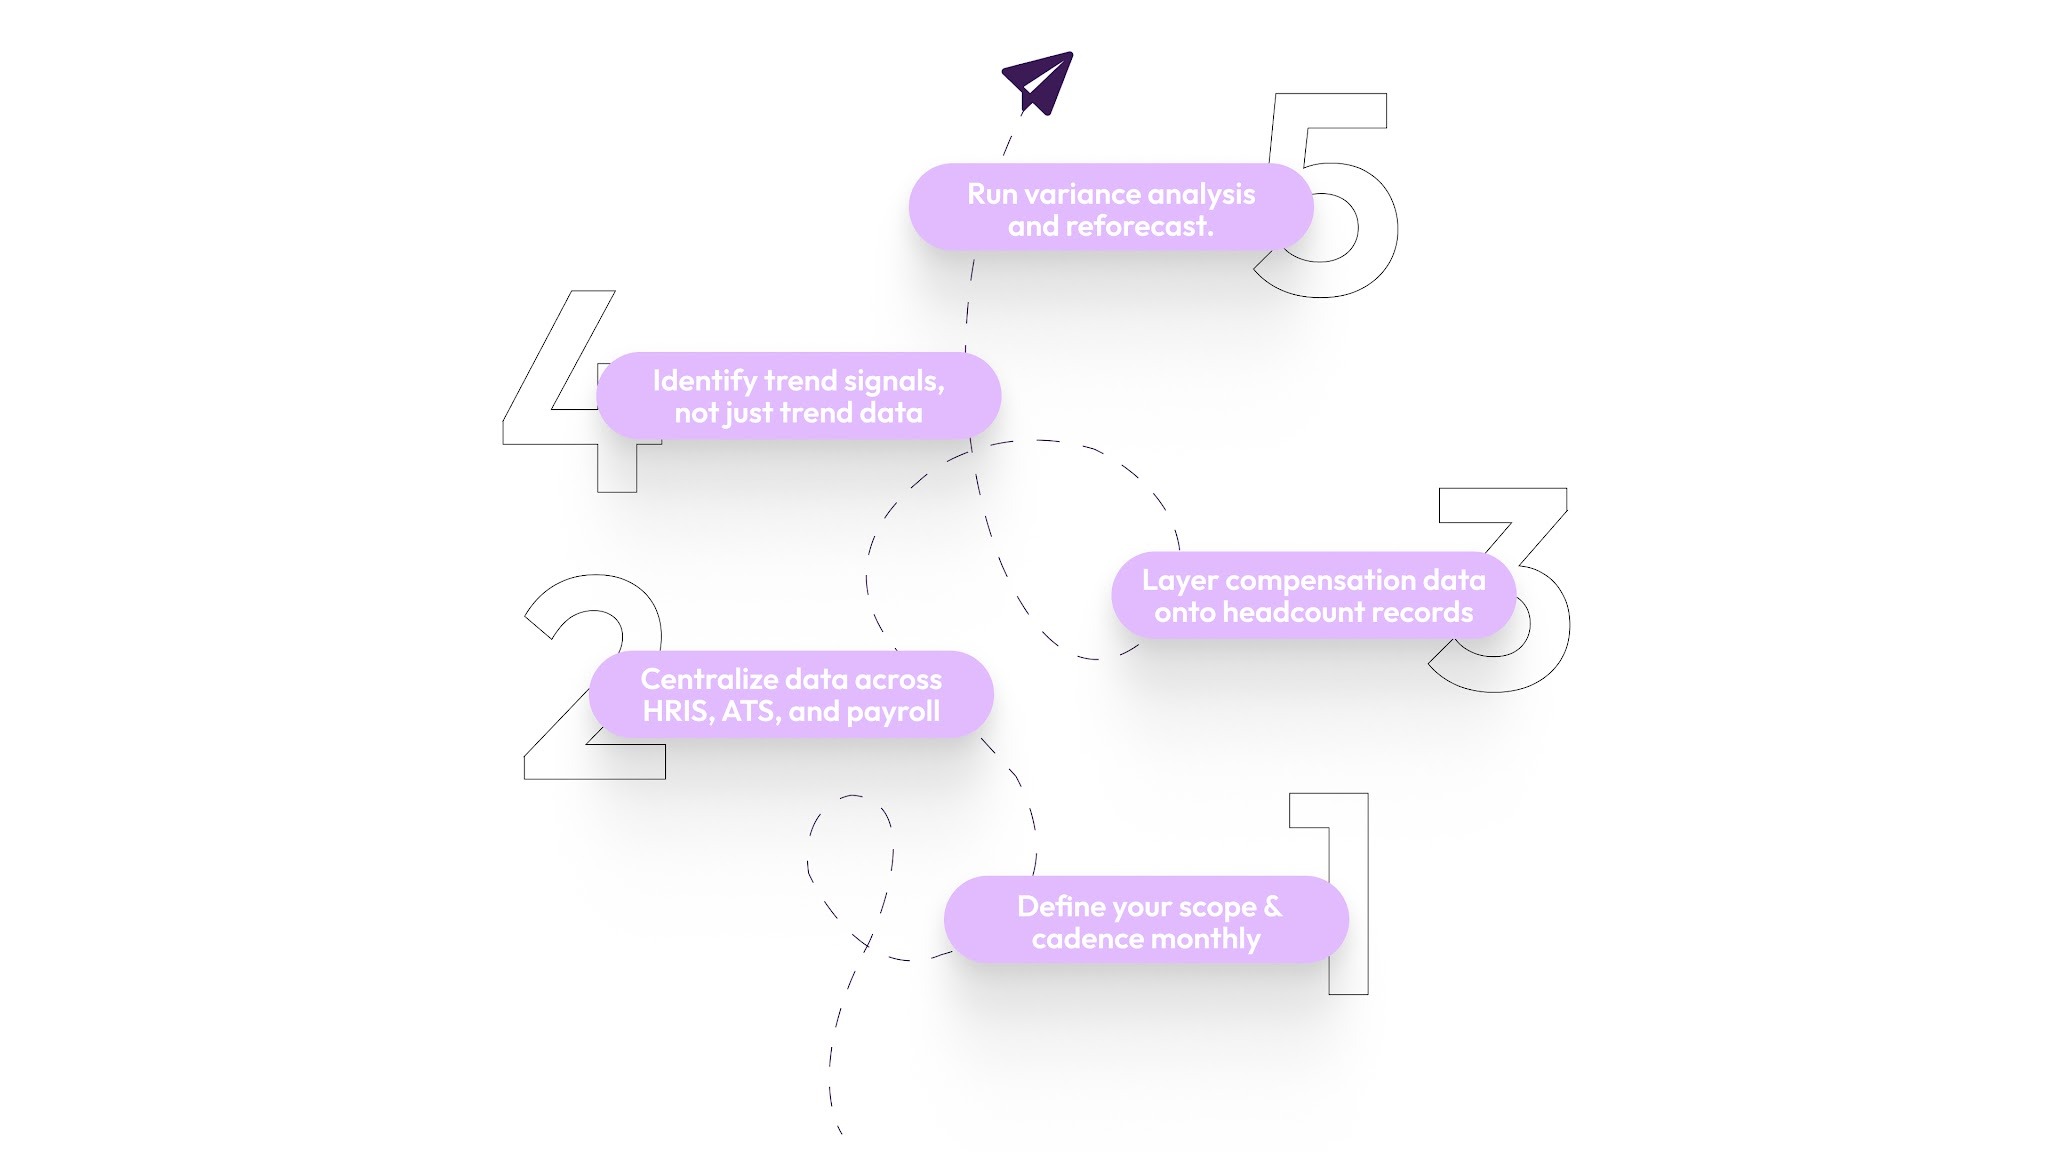
- Step 1: Define your scope and cadence monthly for companies growing more than 25% year-over-year. Quarterly for stable orgs. Always before board prep. Lock in scope by department, location, employment type, and cost center, and agree on definitions with Finance before pulling any data.
- Step 2: Centralize data across HRIS, ATS, and payroll because most analysis failures start here. Three systems, three headcount numbers, one confused planning meeting. Designate HRIS as your master headcount record. Build a weekly sync with Finance for approved FTE counts.
- Step 3: Layer compensation data onto headcount records. Attach annualized cost, compa-ratio, and equity value to each headcount record. This turns a workforce report into a financial instrument and finally gives CFOs the labor cost view they've always asked HR for. Platforms like CandorIQ link compensation data directly to headcount records so the full cost picture is always visible, without rebuilding it every cycle.
- Step 4: Identify trend signals, not just trend data. A chart isn't a decision. Ask: Is this trend accelerating? Is it isolated to one manager's team? Does it correlate with a comp change, a reorganization, or a leadership transition? Annotate data with business context so the pattern tells a story.
- Step 5: Run variance analysis and reforecast. Compare the current headcount to the original plan. Calculate the in-year budget impact of each variance. This is the step most HR teams skip. But this is the one that CFOs care about most in Q2 and Q3 reforecast cycles.
Also Read: Reduce Employee Attrition Using HR Analytics
Once you have a reliable analysis process, you can go further, using your trend data to spot attrition risk before employees walk out the door.
6 Ways of Using Headcount Trend Data to Predict and Prevent Attrition
Most companies measure attrition after it happens. The best ones use headcount trend data to see it coming. Here are six ways to shift from reactive to predictive:
1. Track Compa-Ratio Drift By Department
When a team's average compa-ratio drops below 0.85, attrition risk spikes. This drift happens slowly, through market movement, merit underspend, or pay band lag. Headcount data alone won't catch it. You need compensation data attached to your headcount records.
2. Watch Offer Acceptance Rate Trends
Declining acceptance rates signal that your comp positioning is falling behind the market. You're losing headcount before it's even gained. Tracking this monthly by level and department gives Recruiting and People Ops early warning.
3. Segment Attrition By Tenure Band
High attrition at 0–12 months points to onboarding or expectation failures. High attrition at 18–36 months often signals promotion path or comp stagnation. Each band requires a different intervention, but you can only see that by segmenting the trend data.
4. Monitor Span Of Control Over Time
Managers carrying more than 8–10 direct reports consistently are a flight risk themselves. Headcount trend data that tracks manager load surfaces this before a key leader burns out, and before their whole team follows them out the door.
5. Identify Headcount Concentration Risk By Region
For distributed U.S. teams, over-indexing headcount in a single metro creates fragility. If 40% of your engineering team is in one city, a local labor market shift or the entry of a strong competitor into that market can accelerate attrition faster than national trends predict.
CandorIQ's workforce management dashboard lets you track headcount distribution by region in real time, so concentration risk is visible before it turns into a retention problem.
6. Separate Regrettable From Non-Regrettable Attrition
High performers leaving in their second year is a different emergency than low performers exiting after four years. Headcount trend data segmented by performance tier gives People Ops the ability to tell those two stories apart and prioritize the right response.
Predicting attrition only works if your underlying analysis is clean. The next section covers the five mistakes that corrupt the analysis before it even starts.
5 Common Headcount Trend Analysis Mistakes You Should Avoid
Most headcount analysis problems aren't caused by bad data. They're caused by a bad process. Here are the five mistakes that derail enterprise teams most consistently:
- Treating Headcount As A Snapshot, Not A Trend: A monthly headcount report without 6–12 months of context is noise. One month of data tells you a number. Six months of data tells you a direction. Twelve months tell you a pattern you can act on.
- Separating Headcount Data From Compensation Data: Headcount without labor cost context makes budget conversations impossible. Every headcount record should carry annualized comp cost, compa-ratio, and equity value. Without that, you're presenting half the picture to Finance.
- Letting Hr And Finance Use Different Headcount Definitions: HR counts active employees. Finance counts approved FTEs. Recruiting tracks open reqs. This routinely produces five- to six-figure errors in quarterly planning. Agree on one master definition and one system of record before analysis begins.
- Ignoring Mid-Cycle Reforecast Triggers: Headcount plans built in November shouldn't be locked until December of the following year. A fundraiser, an acquisition, or a market shift all require immediate reforecasts. Teams that only review headcount annually are always working from stale plans.
- Using the Same Model for Distributed Teams: A company with employees across 20 U.S. states needs geo-aware headcount analysis. Applying a single salary assumption across New York, Austin, and remote U.S. creates systematic pay inequity and compliance exposure under state-level transparency laws.
Avoiding these mistakes is easier when you have the right platform underneath your process.
Also Read: How Digital HR is Transforming the Workplace
From Headcount Numbers to Workforce Intelligence
As companies scale from 200 to 2,000 employees, HR, Finance, and Recruiting all track headcount separately, so the numbers don’t match, and decisions get made on inaccurate data.
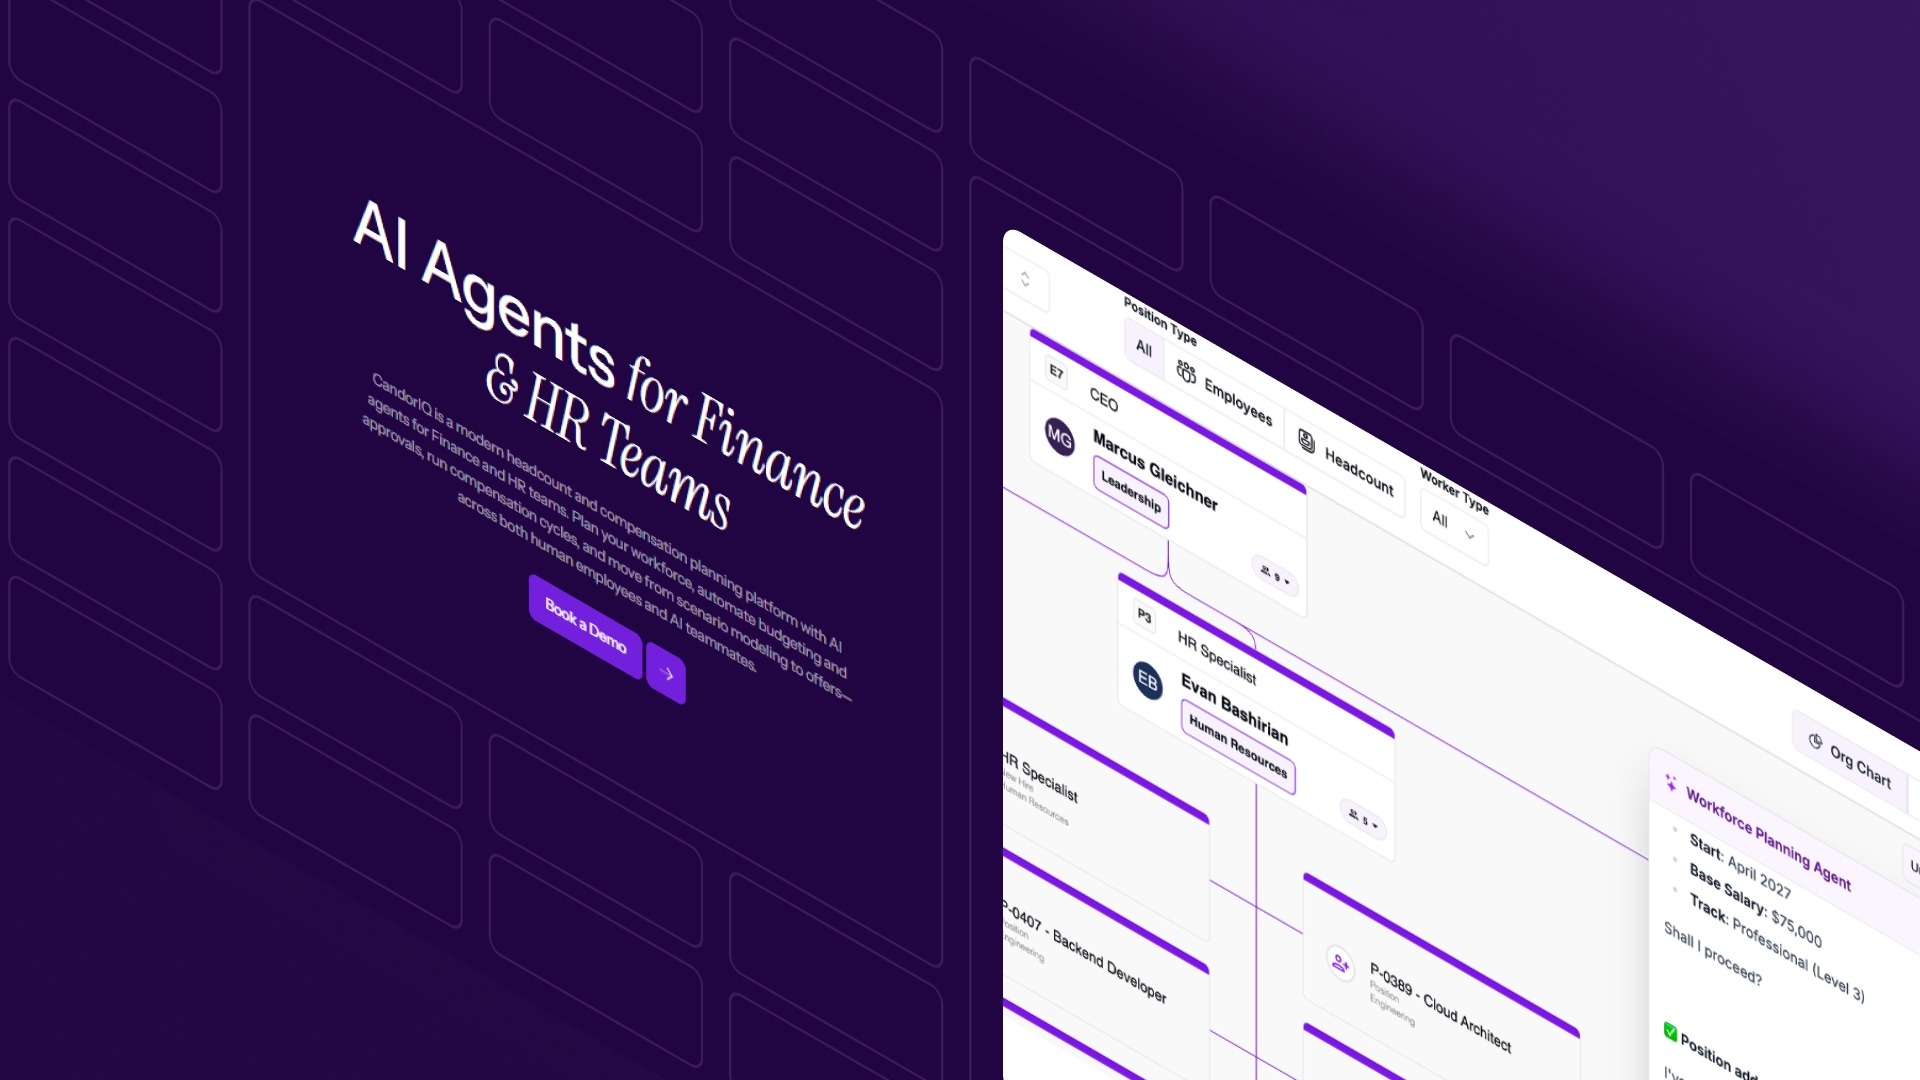
CandorIQ is a unified compensation and headcount planning platform built for exactly this stage of growth. It gives HR, Finance, and People Ops a single place to plan headcount, attach compensation costs, model scenarios, and route approvals, without the spreadsheet chaos that causes these misalignments in the first place.
- Headcount Scenario Planning: Model future org charts and their full financial implications. Toggle between base, upside, and downside hiring scenarios and compare each against budget thresholds in real time.
- Compensation & Payband Builder: Define pay bands by level, location, and department. Apply geo-adjusted salary benchmarks so your headcount cost analysis reflects actual U.S. market rates, not a national average.
- Workforce Management Dashboard: Track open roles, filled seats, attrition, and promotion rates in one view. Align actuals vs. plan on headcount and compensation across every cost center.
- Headcount Requests & Approvals: Standardize new hire requests with embedded rationale and budget context. Route approvals dynamically and sync directly with your ATS and Finance systems.
- AI Agent: Ask natural language questions to analyze comp gaps, forecast headcount needs, and model the budget impact of hiring decisions, without building another spreadsheet.
CandorIQ eliminates the gap between what HR reports and what Finance needs, so every headcount decision is grounded in the same real-time data.
Conclusion
Headcount trend analysis works best as a continuous process, not a quarterly scramble. When you track the right headcount usage metrics, connect them to compensation data, and align HR and Finance on shared definitions, you stop reacting to workforce problems and start anticipating them. The result is fewer budget surprises, stronger board presentations, and attrition you catch before it compounds.
CandorIQ gives HR, Finance, and People Ops one unified platform to plan headcount, model scenarios, and track compensation costs, without the spreadsheet chaos.
Ready to move from reactive tracking to real workforce intelligence? Book a demo with CandorIQ today.

FAQs
Q. How is headcount trend analysis different from a standard headcount report?
A headcount report shows you today's numbers. Headcount trend analysis tracks changes over 6–12 months, revealing patterns in attrition, hiring velocity, and compensation drift that a single report can never surface.
Q. How do U.S. pay transparency laws affect headcount analysis for distributed teams?
States like Colorado, California, and New York require salary ranges in job postings. This makes geo-adjusted headcount cost analysis essential. You can't maintain pay equity across states without knowing the cost and comp position of each location-based hire.
Q. Can headcount trend analysis help with DE&I reporting?
Yes. Segmenting headcount trends by gender, ethnicity, and level over time reveals representation gaps in hiring, promotion, and attrition. This longitudinal view is far more actionable for DE&I goals than a single-point demographic snapshot.
Q. What role does FP&A play in headcount trend analysis?
FP&A owns the budget side. They track headcount variance against the approved plan, model the financial impact of hiring changes, and use trend data to reforecast labor costs mid-year. Strong HR–FP&A collaboration is what separates reactive from strategic workforce management.
Ready to modernize your workforce and compensation strategy?
See how CandorIQ brings workforce planning and compensation together with AI.