Understanding Compa Ratio Performance Matrix for Fair Compensation
Understand the compa ratio performance matrix for fair compensation. Learn how it helps align employee pay with market rates and ensures equitable pay practices.

In fast-growing companies, compensation gaps can quietly hurt morale and retention. In fact, approximately 38% of organizations did not conduct a pay equity analysis in 2024, reflecting widespread gaps in pay equity governance among companies aiming for fair compensation practices.
For CPOs, CFOs, and People Ops leaders managing lean HR/finance teams, the compa ratio performance matrix provides a clear path. It aligns pay with market benchmarks and ensures fairness across regions.
This blog breaks down how the matrix turns fragmented compensation workflows into data-driven decisions. You’ll improve budget management, support growth, and keep your top talent happy. Let’s dive into how equitable pay can become a powerful growth advantage.
At a glance
- Compa ratio reveals pay fairness: It's a simple calculation. that shows if you're paid below, at, or above market rate.
- The performance matrix identifies where your money should go: Combine compa ratio with performance ratings to spot underpaid top performers (flight risks), overpaid underperformers, and everyone in between.
- Avoid expensive mistakes: Outdated market data, ignoring geographic differences, and neglecting updates waste money and talent. Keep it a living tool
- Put it to work across your compensation practices: Use compa ratio to drive merit increases, guide job offers, forecast budgets, identify retention risks, and conduct pay equity audits.
- Essential for scaling organizations: Compa ratio turns fragmented compensation into data-driven strategy, controlling costs while keeping top talent.
What is the Compa Ratio?
The compa ratio (comparative ratio) is a compensation metric that measures how an employee’s salary compares to the midpoint or median of a salary range for their role, either internally or against the market. It is calculated as:
A compa ratio of 100% means the salary aligns precisely with the market midpoint; below 100% suggests the employee is under the midpoint (potentially underpaid or new in the role). In comparison, above 100% indicates pay over the midpoint.
Why Companies Obsess Over Compa Ratio?
Compa ratio isn't just math; it's a fairness detector.
For organizations, it helps:
- Spot pay inequities before they become legal issues
- Budget salary increases strategically
- Ensure new hires aren't paid more than seasoned employees
- Maintain competitive compensation without overspending
For employees, it reveals:
- Whether you're underpaid for your experience level
- If there's room for negotiation
- How your pay compares to market standards
Compa ratio shows exactly where you stand on the pay scale, and whether you're heading in the right direction. Understanding how companies should be determining salary involves understanding this positioning within market benchmarks, which feeds directly into fair offer decisions and internal equity.
The sweet spot? Most companies aim to keep employees between 80% and 120%. Anything outside this range triggers a red flag for HR to investigate.
However, compa ratio isn't one-size-fits-all; it comes in three distinct types, each telling a different compensation story.
The Three Types of Compa Ratios You Need to Know
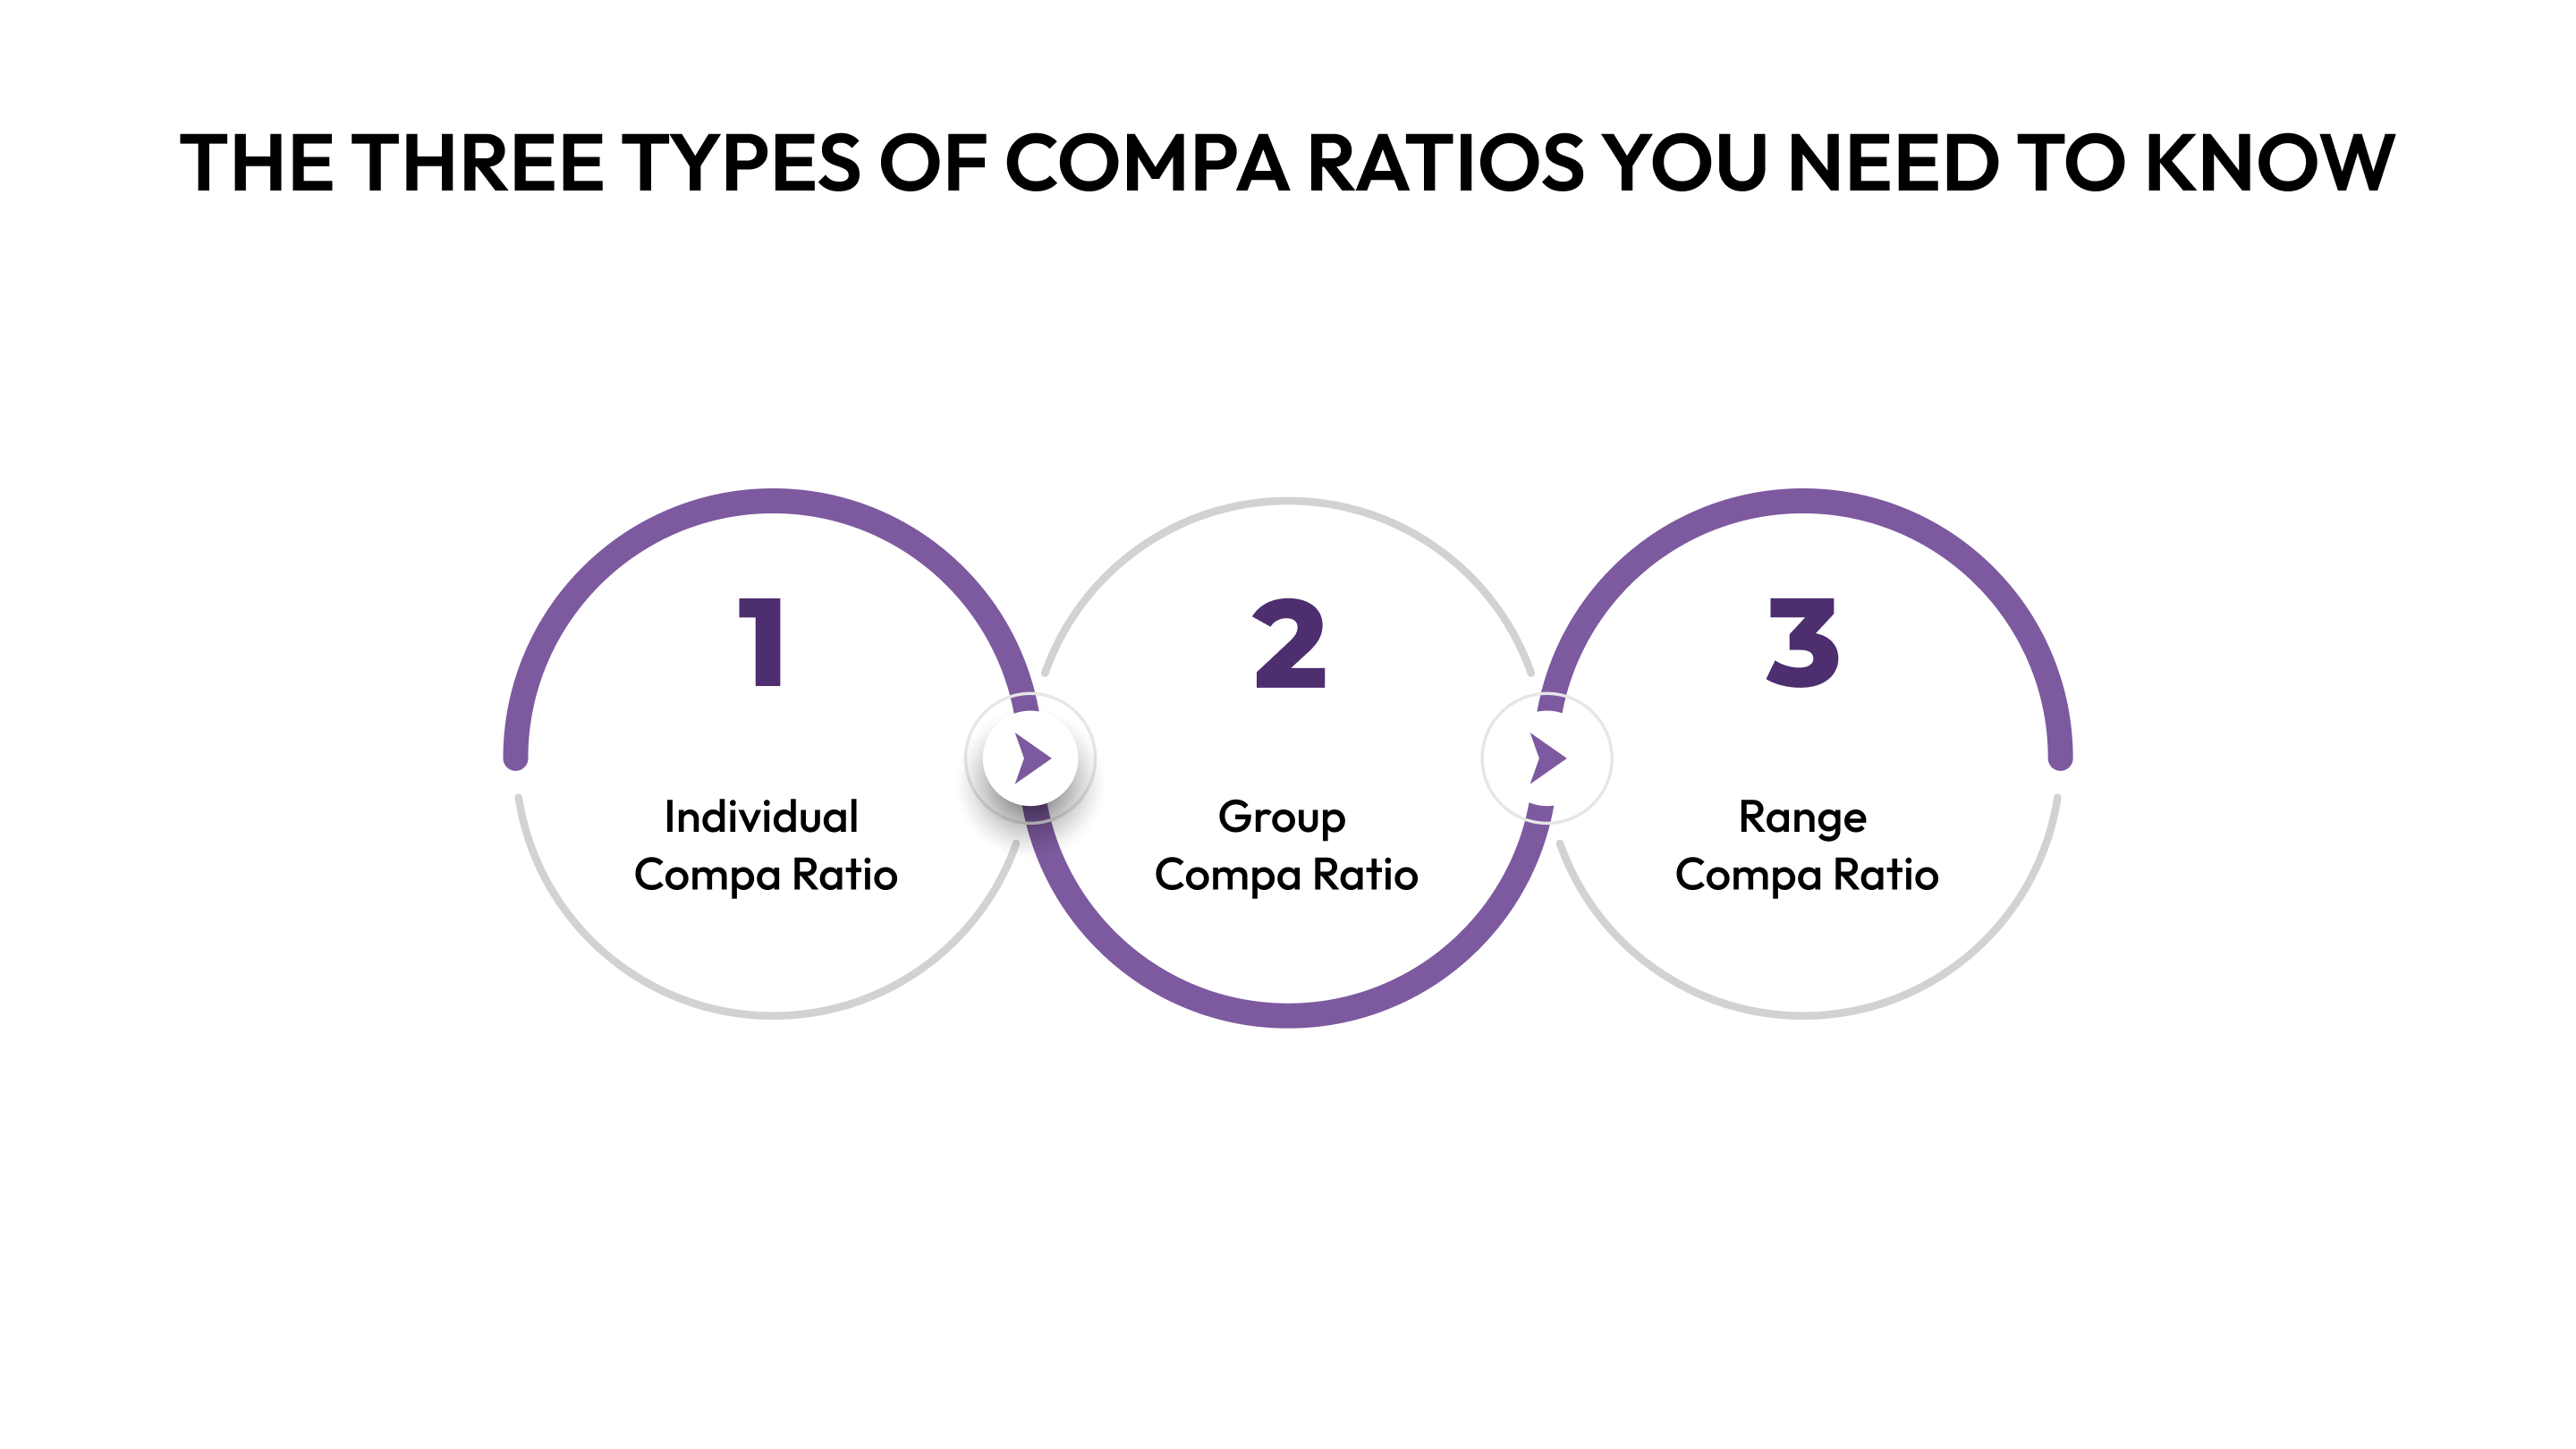
The Compa ratio is of three types. Each type serves a purpose. Here’s what you need to know:
Individual Compa Ratio: Your Personal Pay Position
This is the number that matters most to you personally. It compares your salary against the midpoint for your specific job.
- The calculation: Your salary ÷ Job midpoint × 100
- What drives individual compa ratios:
- Years in the role
- Performance ratings
- Specialized skills or certifications
- Time since last raise
Group Compa Ratio: The Department View
This zooms out to show how an entire team or department is compensated collectively.
- The calculation: Average salary of the group ÷ Average midpoint × 100
- Why this matters: It reveals if entire departments are over or underpaid. A ratio of 85% for your engineering team might explain why they keep leaving for competitors. This is particularly important for IT companies and specialized technical roles, where market rates shift rapidly and retention depends on staying competitive.
Platforms like CandorIQ automatically calculate group compa ratios across departments, making it easy to spot these patterns without manual spreadsheet work.
Range Compa Ratio: The Big Picture
This is the executive view, showing compensation health across the entire organization.
- The calculation: Total payroll ÷ Sum of all midpoints × 100
- Companies typically target a range of compa ratio between 95% and 105%. Too low suggests you're losing talent to better-paying competitors. Too high means you might be overspending on compensation.
- The strategic advantage: CFOs use this to forecast budget needs and ensure the company remains competitive without breaking the bank.
Together, they create a complete compensation picture. But how?
.png)
Building Your Compa Ratio Performance Matrix: A Step-by-Step Blueprint
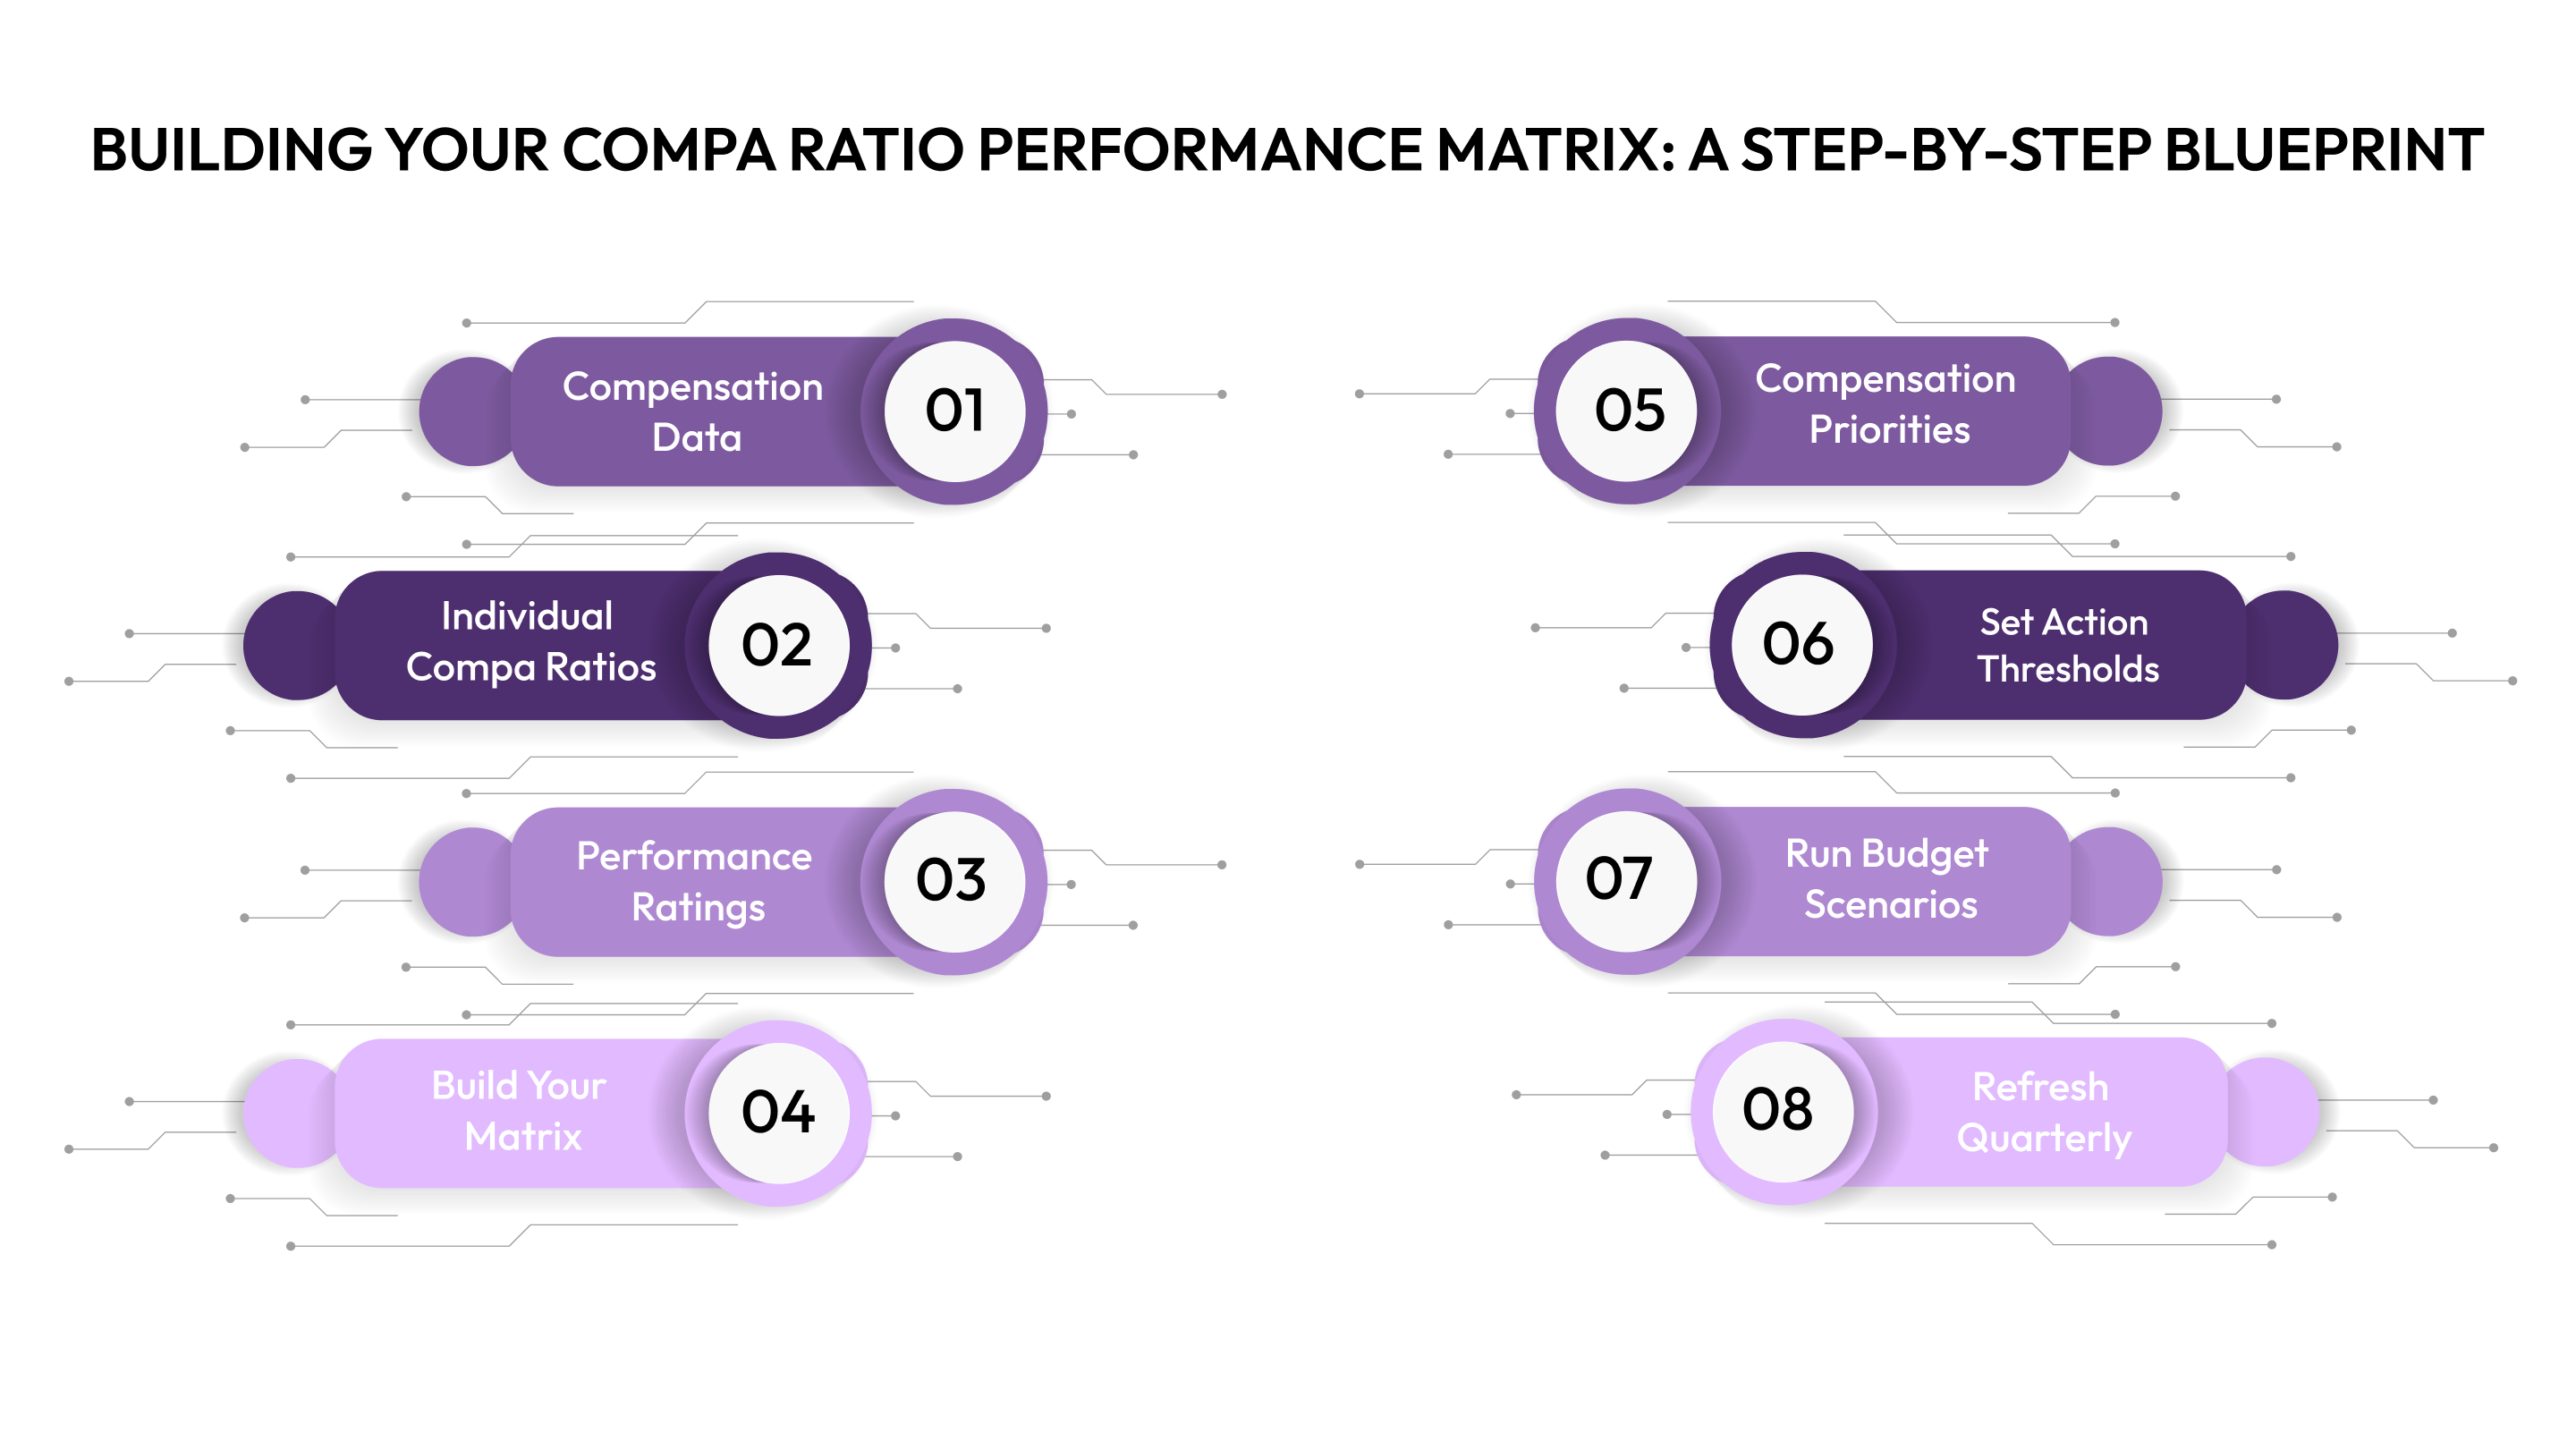
A compa ratio performance matrix combines two critical data points, pay positioning and employee performance, to create a strategic compensation tool. It reveals who's underpaid, who's at risk of leaving, and where your budget should go.
Step 1: Gather Your Compensation Data
Start with clean, current salary information for your organization.
You'll need:
- Current base salaries for all employees
- Job titles and levels
- Salary range midpoints (from your comp bands or market data)
- Most recent performance ratings
- Hire dates and tenure
Pro tip: If you're using spreadsheets across HR and Finance, consolidate everything into one source of truth first. Fragmented data kills accuracy. CandorIQ connects directly to your HRIS and pulls this data automatically, eliminating manual data entry and version control nightmares.
Small IT companies particularly benefit from systems that can manage custom compensation models without requiring extensive manual configuration.
Step 2: Calculate Individual Compa Ratios
Run the math for each employee: (Current Salary ÷ Salary Range Midpoint) × 100
This is where automation saves hours. With 50+ employees, manual calculations become error-prone and time-consuming.
What to watch for: Ratios below 80% or above 120% need immediate attention. Flag these for deeper analysis.
Step 3: Map Performance Ratings
Pull your most recent performance review data. Standardize ratings if different managers use different scales.
Common rating systems:
- 5-point scale (1-5)
- 3-tier system (Below/Meets/Exceeds)
- 4-box model (Development/Solid/Strong/Exceptional)
Consistency matters here. A "meets expectations" from one manager should mean the same thing across all departments.
Step 4: Build Your Matrix
Create a grid with compa ratio on one axis and performance on the other.
- X-axis (Compa Ratio): Divide into ranges like 80-90%, 90-100%, 100-110%, 110-120%
- Y-axis (Performance): Use your rating categories from lowest to highest
Plot each employee on this grid. Patterns emerge immediately. Rather than building this manually in Excel, compensation platforms like CandorIQ generate interactive matrices that update in real-time as your data changes.
Step 5: Identify Your Compensation Priorities
Now the matrix tells you where to act. Each quadrant reveals a different compensation challenge:
High Performance + Low Compa Ratio (Top Left):
- Your flight risks
- Underpaid top performers
- Immediate raise candidates
- Competitors will poach them
High Performance + High Compa Ratio (Top Right):
- Rewarded stars
- Limited raise runway
- Consider promotions or stretch roles
- Retention through growth opportunities
Low Performance + Low Compa Ratio (Bottom Left):
- Development opportunities
- Recent hires ramping up
- Performance improvement plans
- Assess role fit
Low Performance + High Compa Ratio (Bottom Right):
- Your biggest problem
- Overpaid underperformers
- Compensation misalignment
- Needs management intervention
Step 6: Set Action Thresholds
Define clear rules for compensation decisions based on matrix positioning.
Example framework:
- High performers below 90% compa ratio → 8-12% increase priority
- Solid performers at 95-105% → 3-5% merit increase
- Top performers above 115% → promotion track or special project opportunities
- Low performers above 110% → performance improvement required before next increase
Step 7: Run Budget Scenarios
Use the matrix to model your compensation budget needs.
Calculate total investment for:
- Bringing flight risks to competitive positioning
- Standard merit increases by performance tier
- Market adjustments for compressed ranges
- Promotion budget allocation
This gives your CFO the data they need to approve compensation decisions. No more guesswork or negotiating in the dark. CandorIQ lets you model multiple budget approaches side-by-side, showing exactly what each strategy costs before you commit.
Step 8: Refresh Quarterly
Compensation isn't set-it-and-forget-it. Markets shift. People get promoted. Performance changes.
Update your matrix when:
- Performance reviews complete
- Market salary data refreshes
- Major hiring waves occur
- Budget planning cycles begin
For scaling organizations, quarterly reviews prevent small issues from becoming retention crises.
The matrix transforms compensation from reactive firefighting into strategic planning. Your leadership team sees exactly where pay equity issues exist and what fixing them costs, before making a single offer.
For companies considering equity compensation as part of their strategy, understanding the compa ratio impact of equity grants becomes critical, especially when determining how equity affects total compensation positioning and market competitiveness.
Building a compa ratio performance matrix is easy. Avoiding costly mistakes? That takes discipline.
Critical Mistakes That Sabotage Your Performance Matrix
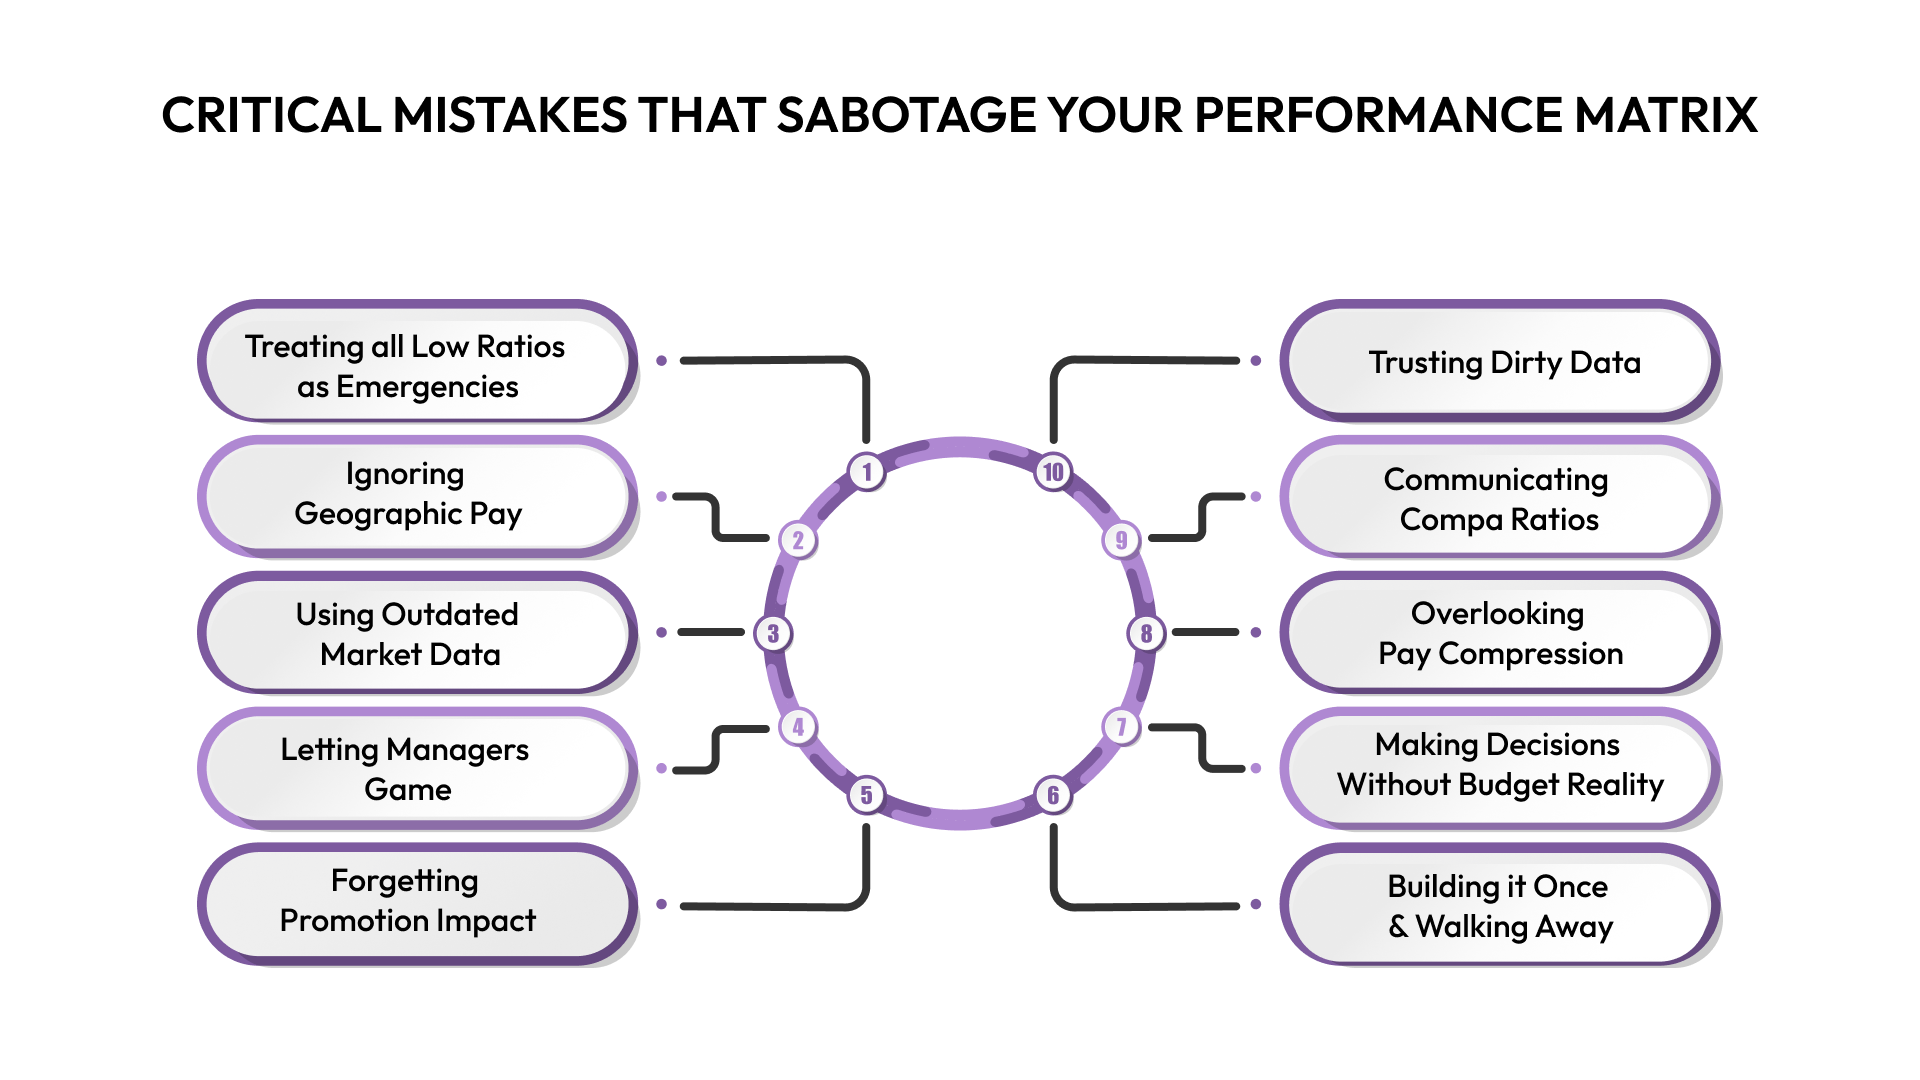
Managing compensation at scale is challenging. Here are common pitfalls that can cost real money, blow budgets, lawsuits, and lose top talent:
- Treating all low ratios as emergencies: Not every low compa ratio needs an instant raise. Layer in tenure data before making decisions.
- Ignoring geographic pay differences: One salary for all locations creates inequity. Build location-based salary ranges to ensure fairness.
- Using outdated market data: Markets shift fast. Refresh data annually, or more often for hot roles, to stay competitive.
- Letting managers game performance ratings: Rating inflation can wreck your matrix. Implement forced distribution and review ratings regularly.
- Forgetting promotion impact: Promotions drop compa ratios. Plan for this with minimum ratios and budgeted increases.
- Building it once and walking away: Your matrix needs regular updates, especially in high-growth phases. Treat it as a living tool.
- Making decisions without budget reality: Prioritize raises based on budget. Know your constraints before making promises.
- Overlooking pay compression: Senior employees getting paid less than juniors? Flag this issue with a compression analysis layer.
- Communicating compa ratios without context: Always explain compa ratios in context. Focus on growth, not static numbers.
- Trusting dirty data: Clean job titles and levels first. Dirty data leads to bad decisions.
Your matrix is a strategic asset if you follow the right discipline. Avoid these mistakes to ensure its success. CandorIQ includes location-based compensation bands, automatically adjusting compa ratios based on where employees actually work.
You've built the matrix and avoided the landmines. But how to make the compa ratio actually useful in your day-to-day compensation decisions?

Practical Tips to Put Compa Ratio to Work for Smarter Compensation
Building a compa ratio performance matrix is just the beginning. To make it truly effective, you need to implement strategies that turn it into a powerful tool for fair compensation.
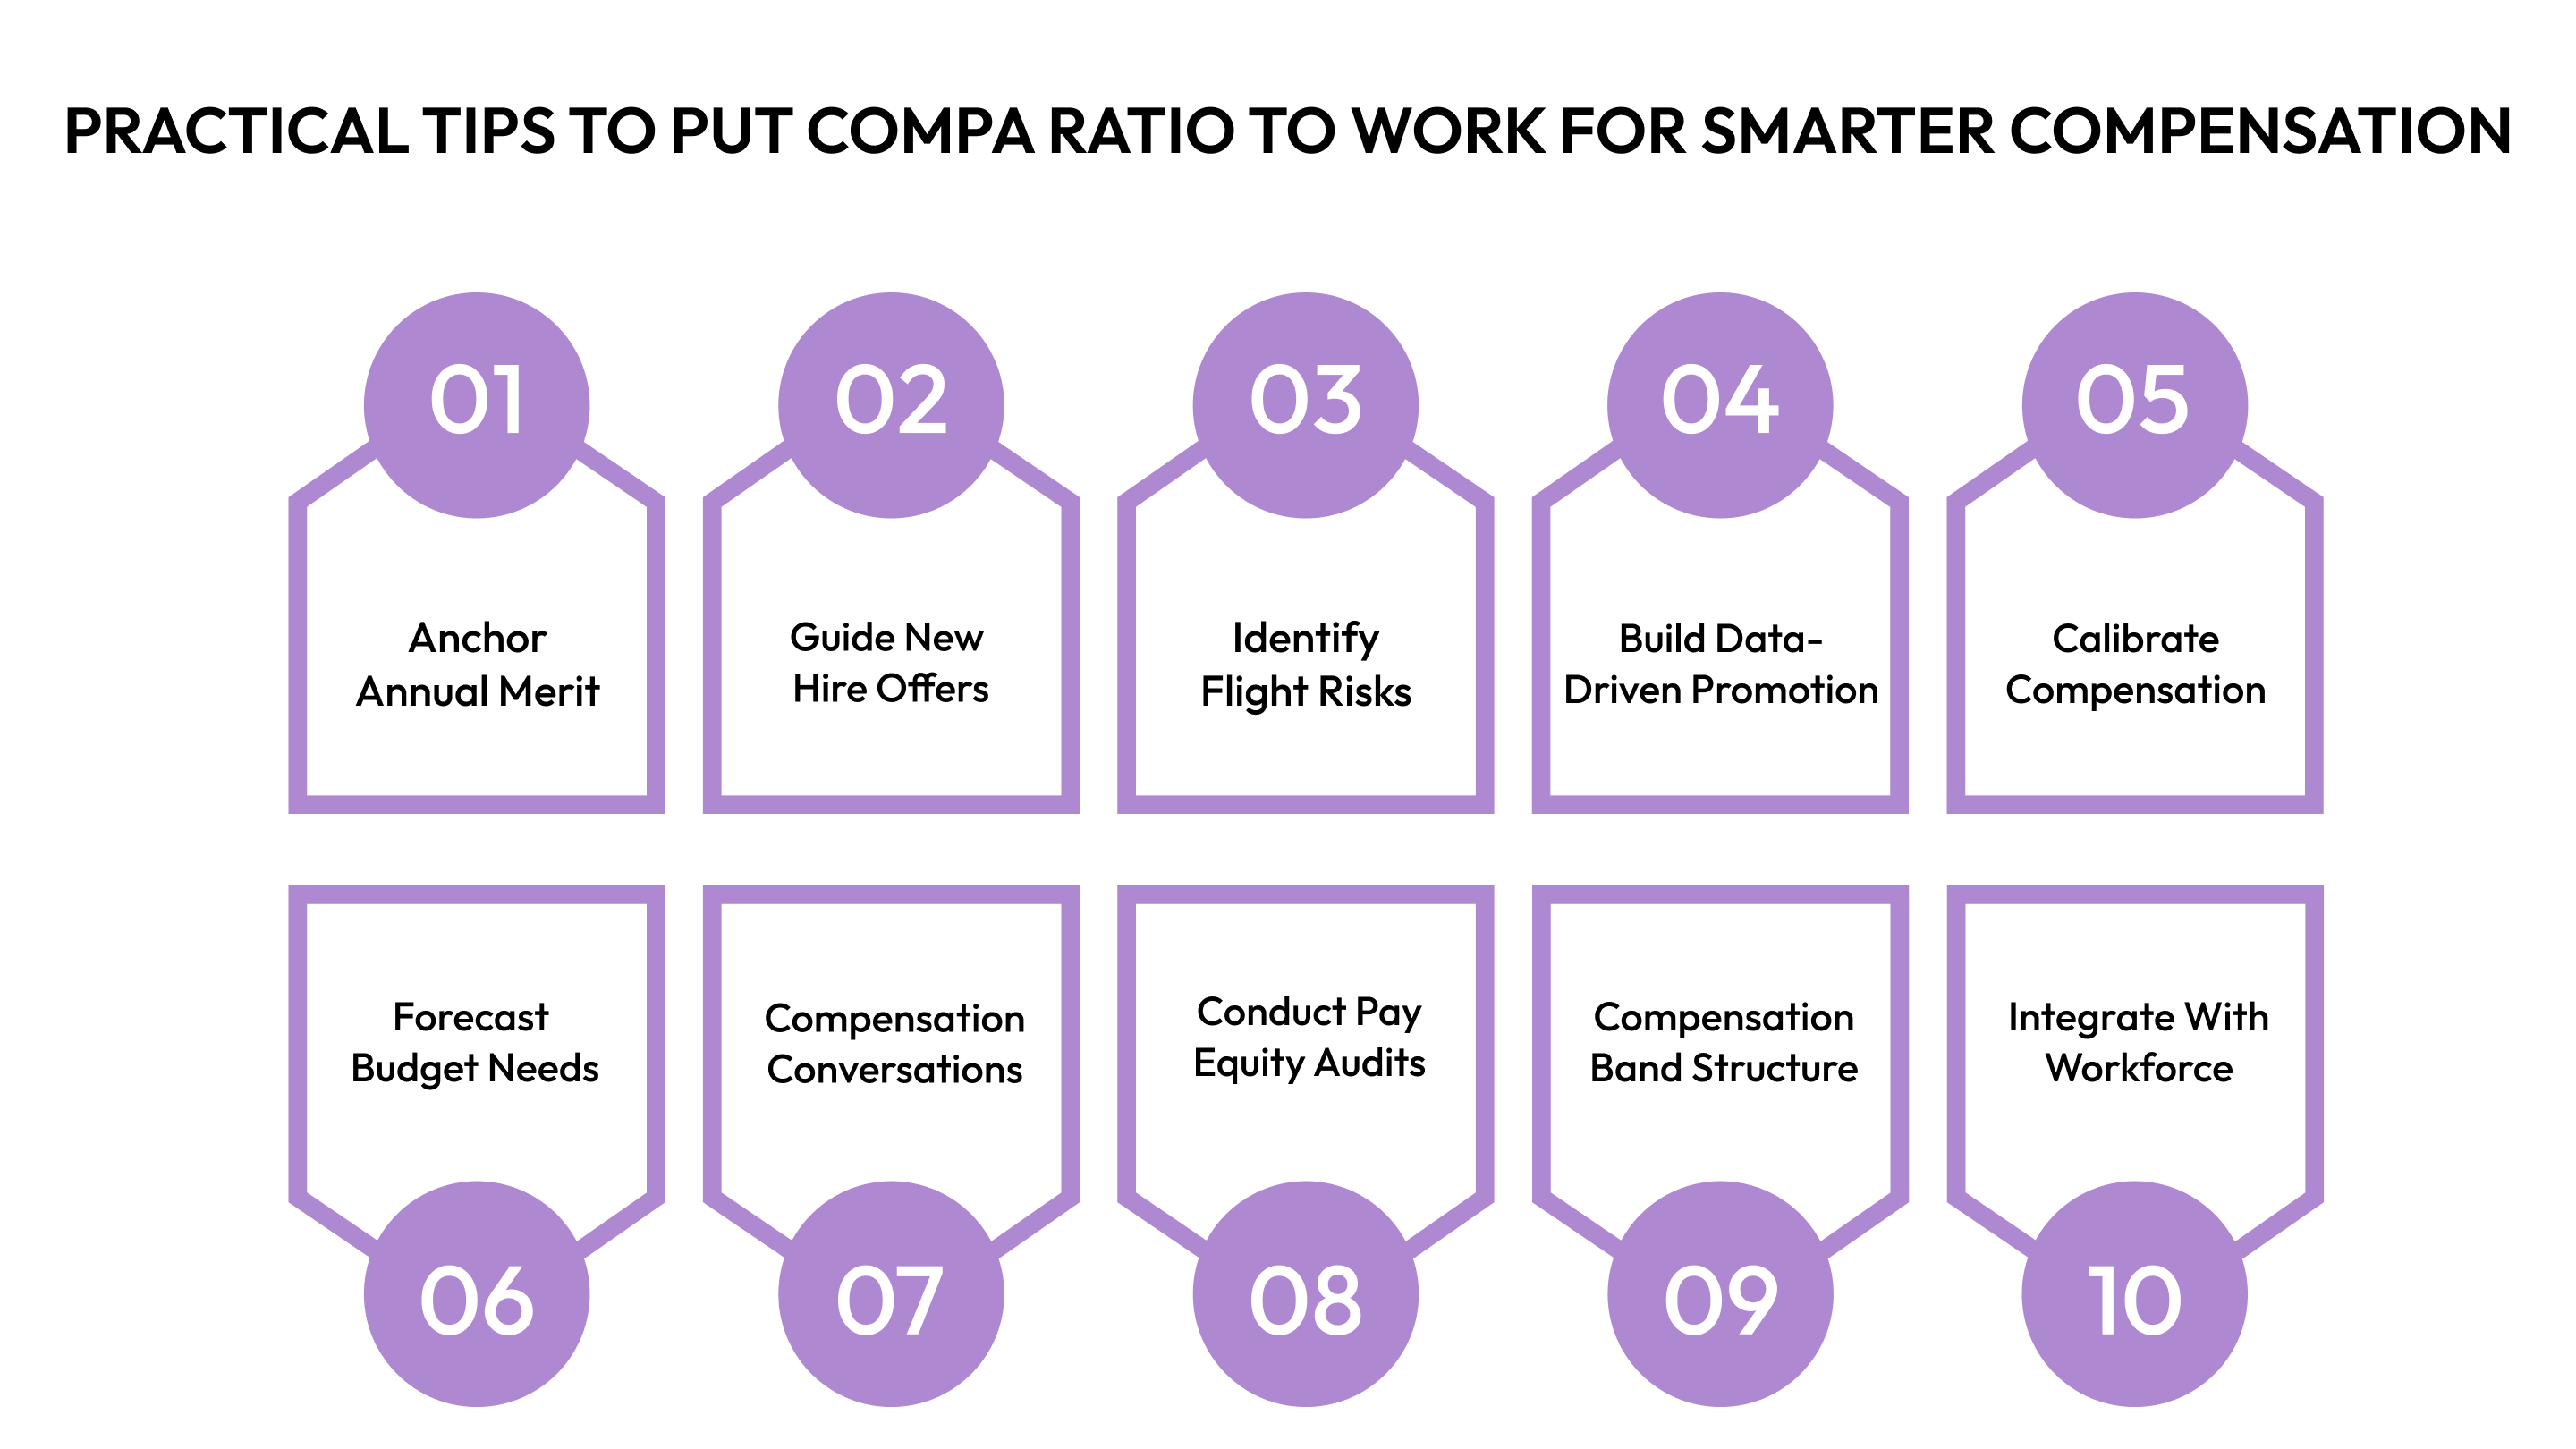
Here are practical strategies to turn it into a dynamic tool that drives fair pay and keeps your best people engaged:
- Anchor Annual Merit Increases: Differentiate raises based on performance and compa ratio. Reward underpaid stars and correct pay positioning.
- Guide New Hire Offers: Check compa ratio before making offers. Target new hires at 85-95% to avoid inequity.
- Identify Flight Risks: Run quarterly reports to flag high performers with low compa ratios. Retain top talent before they leave.
- Build Data-Driven Promotion Guidelines: Set clear promotion standards to prevent pay disparities between promoted employees and their new peer group.
- Calibrate Compensation Across Departments: Ensure fair compensation across teams. Adjust budget allocation where needed to avoid inequity.
- Forecast Budget Needs: Use the compa ratio to forecast compensation costs. Say goodbye to guesswork and plan with precision.
- Support Manager Compensation Conversations: Arm managers with compa ratio context to handle employee compensation questions confidently.
- Conduct Pay Equity Audits: Use the compa ratio for pay equity audits. Identify and fix pay gaps before they become legal or reputation issues.
- Optimize Your Compensation Band Structure: Ensure your salary bands align with actual pay distribution. Recalibrate if most employees are clustered at one end.
- Integrate With Workforce Planning: Link compensation planning to headcount planning for clear budget visibility.
Compa ratio isn’t just a metric, it’s a powerful business tool. Use it to drive fair compensation and informed decisions as your company scales.
Final Thoughts
The compa ratio performance matrix isn't just another HR framework—it's your roadmap to fair, strategic compensation that scales with your business.
For growing organizations juggling distributed teams and lean operations, manual compensation management eventually breaks. Spreadsheets fragment across departments. Data goes stale. Budget decisions become reactive instead of strategic.
If you're ready to move beyond compensation chaos, CandorIQ brings your comp planning, headcount management, and budget governance into one platform. See how teams like yours are making smarter compensation decisions. Book a demo to explore what's possible.
Frequently Asked Questions
1. Can compa ratio be above 100%?
Yes. Compa ratios above 100% indicate pay above the salary range midpoint. This is normal for high performers, tenured employees, or hard-to-fill roles. Concern arises only when ratios consistently exceed 120%, limiting future raise potential.
2. What's the difference between compa ratio and pay range penetration?
Compa ratio compares salary to the midpoint (÷ midpoint × 100). Pay range penetration shows position within the full range from minimum to maximum ((salary - min) ÷ (max - min) × 100). Both measure pay positioning but use different reference points.
3. How do you fix pay compression using compa ratio?
Identify compression by comparing compa ratios of senior employees to newer hires in similar or lower roles. If the gap is less than 10-15%, budget market adjustments for the senior employees to restore appropriate pay differentials.
4. Does compa ratio account for bonuses and equity?
No. Compa ratio focuses strictly on base salary compared to base salary ranges. Total compensation analysis requires separate calculations that include variable pay, equity, and benefits. Both metrics serve different strategic purposes.
5. What compa ratio indicates someone is underpaid?
Context matters, but generally: below 85% after 2+ years in role signals potential underpayment, especially for solid or high performers. Below 80% at any tenure requires immediate investigation regardless of performance level.
Ready to modernize your workforce and compensation strategy?
See how CandorIQ brings workforce planning and compensation together with AI.