11 Workforce Planning ROI That Prove Your Impact in 2026
Workforce planning ROI isn't just a metric. It's your strategic edge. Discover 11 proven metrics US HR and Finance leaders use to measure and maximize it.


Are your workforce planning decisions actually moving the needle, or just keeping the lights on?
In 2025, workforce planning is now a top-three priority for HR leaders in the United States. Yet, 66% of resource leaders confirm their workforce planning process is limited to headcount planning, and they find it hard to show ROI for their strategic planning work. That gap, between doing the work and proving its value, is exactly what this blog addresses.
When HR and Finance teams can't measure workforce planning ROI, budgets get cut, headcount decisions get delayed, and leadership loses trust in People teams. This blog will explore 11 clear metrics that change that.
Key Takeaways
- Workforce planning ROI is the financial return from structured headcount forecasting, compensation management, and HR-Finance alignment, not a count of tasks completed or cycles run.
- Most US companies can't measure it because HR tracks activity while Finance tracks budget, and the two teams rarely share the same live data. That disconnect is what makes ROI invisible.
- The metrics that define workforce planning ROI span compensation cycle time, headcount variance, pay equity gap rate, offer acceptance rate, and internal mobility, each one pointing directly to where planning is generating or destroying value.
- But building a workforce planning ROI framework comes down to five steps: audit your current state, assign dollar values to planning failures, set a measurement cadence, connect HR and Finance to one source of truth, and report in the language your CFO and CPO actually respond to.
- CandorIQ brings compensation cycles, headcount approvals, pay band management, and scenario planning into one platform, so your HR and Finance stop reconciling two versions of the plan and start making decisions from the same one.
What Is Workforce Planning ROI?
Workforce planning ROI is the measurable financial return an organization generates from structured headcount forecasting, compensation management, and HR-Finance alignment, relative to the cost of reactive or disorganized planning.
It's not just about how many roles you filled or how fast you ran a comp cycle. It's about whether your planning decisions led to better financial outcomes, such as lower attrition costs, less budget overspend, faster hiring for revenue-generating roles, and fewer compensation errors.
Let's look at why measuring it actually matters.
Why Measuring Workforce Planning ROI Matters
Most organizations track workforce activity. Very few track workforce outcomes. Here's why shifting to outcome-based measurement changes everything:
- It gives HR financial credibility. Replace vague wins with hard numbers like reduced overspend, faster time-to-fill, and revenue impact, metrics CFOs actually care about.
- It prevents budget leakage early. Tracking headcount variance and offer acceptance rates flags overspending and weak compensation before they affect hiring outcomes.
- It exposes root causes, not symptoms. Metrics like cycle time and pay equity gaps pinpoint exactly where processes or structures are breaking down.
- It strengthens the case for better tools. Clear ROI data shows the cost of manual processes and poor planning, making investment decisions easier to justify.
- It elevates workforce planning to a strategy. ROI measurement positions HR as a data-driven function with direct impact on business performance.
However, most companies still can't do it efficiently.

6 Reasons Why Most US Companies Can't Measure Workforce Planning ROI in 2026
You aren’t failing to measure workforce planning ROI because they lack data. They’re failing because their systems, processes, and ownership models were never designed for it.
- Data is fragmented: Disconnected systems break the link between planning decisions and business outcomes, making ROI impossible to measure.
- HR tracks inputs, not impact: Headcount, cycles, and offers don’t reflect outcomes like budget variance, attrition reduction, or revenue contribution.
- HR and Finance lack a single source of truth: Misaligned data creates constant reconciliation issues and unreliable ROI calculations.
- Comp cycles are too slow: Delayed cycles produce outdated insights, limiting real-time decision-making and ROI visibility.
- No audit trail for headcount decisions: Without documented rationale and budgets, it’s impossible to evaluate hiring effectiveness.
- No unified ROI definition: Misaligned success metrics across HR, Finance, and leadership prevent consistent measurement.
Now that you know what's blocking measurement, here are the 11 metrics that fix it.
The 11 Metrics That Define Workforce Planning ROI in 2026
These metrics are not just KPIs. Each one tells a specific story about where your planning is working, and where it's costing you money.
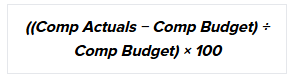
1. Headcount Plan vs. Actuals Variance
It is the percentage difference between your planned headcount and your actual headcount at the end of a quarter or fiscal year.
How to calculate it:
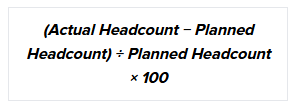
Variance beyond ±5% signals planning breakdowns and misalignment between HR and Finance. It leads to overspend, hiring delays, and unreliable forecasts. High-performing teams maintain ±3% by aligning on a shared, continuously updated plan.
Most teams measure this after the quarter ends. The real value comes from tracking it in real time and correcting before it turns into overspend.
2. Compensation Cycle Time
This is the number of days from the comp cycle launch to final approvals completed.
How to calculate it:
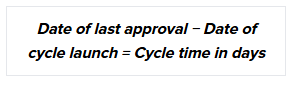
Longer comp cycles reduce decision quality, increase error rates, and negatively impact employee trust and engagement. A cycle extending beyond four weeks typically indicates process inefficiencies rather than capacity constraints.
Cycle time is driven by workflow design. Manual approvals and a lack of visibility create delays, while structured workflows and automated routing significantly improve speed and accuracy.
3. Cost of an Unplanned or Mis-Hire
What it is: The total financial cost of a hire that was either added outside the approved headcount plan or turned out to be the wrong fit.
How to calculate it:
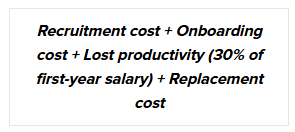
Replacing an employee can cost up to 2× their salary, making mis-hires a significant financial risk. Unplanned roles, approved without structured review, are more likely to result in poor hiring outcomes due to a lack of budget discipline and business justification.
Stronger ROI comes from enforcing approval workflows that require a clear business case upfront, preventing mis-hires instead of just tracking their cost.
4. Offer Acceptance Rate
This is the percentage of job offers extended that candidates accept.
How to calculate it:

A declining offer acceptance rate is a direct signal that your compensation isn’t competitive, whether due to outdated pay bands, incorrect geo-adjustments, or poor value communication. In a market where the average time-to-fill is 42 days, every declined offer resets the clock, increasing hiring delays and cost.
5. Pay Equity Gap Rate
This refers to the percentage of employees whose compensation falls outside the defined pay band for their role, level, and location.
How to calculate it:
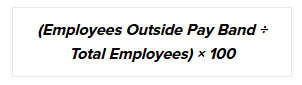
Pay equity gaps create both legal exposure and retention risk. Employees who identify pay disparities are more likely to exit than seek correction, increasing attrition and replacement costs. When gaps surface late, often during audit, the cost to fix them is significantly higher.
6. Headcount Approval Cycle Time
This is the number of days from a headcount request submission to final approval.
How to calculate it:

Delays in approving revenue-generating roles directly impact pipeline, customer growth, and product delivery. Each week of delay translates into a missed revenue opportunity, making this a business risk.
Approval delays are typically driven by a lack of context, not slow decision-making. When requests include clear rationale, budget impact, and role details, decisions are faster and more consistent.
7. HR-Finance Budget Alignment Score
This is how closely your compensation actuals track against your operating plan, measured as a percentage variance.
How to calculate it:
Compensation budget alignment is a direct signal of planning reliability. Staying within 3%–5% of plan builds leadership trust and increases budget ownership; consistent variance erodes both.
This metric reflects planning quality. Strong alignment indicates that comp bands, merit decisions, and headcount planning are all anchored to the same financial baseline.
8. Attrition Rate by Department
This refers to the percentage of employees who leave a specific department in a given period.
How to calculate it:
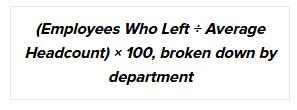
Company-wide attrition hides the real signal. Department-level spikes point to specific issues, compensation gaps, limited growth paths, or management breakdowns. Without this view, retention efforts stay generic and ineffective.
Attrition is often a planning failure, not just an engagement issue. Tracking it by department, level, and tenure reveals where workforce planning is misaligned and where targeted fixes are needed.
9. Revenue Per Employee
This is your total revenue divided by your total headcount.
How to calculate it:
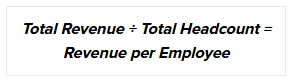
Revenue per employee links headcount directly to business output. A decline signals inefficient scaling, headcount growing faster than revenue, and turns hiring into a cost risk, not a growth driver.
It validates hiring effectiveness. Tracking it alongside headcount growth shows whether new hires are generating returns or simply increasing payroll.
10. Internal Mobility Rate
What it is: The percentage of open roles filled by internal candidates through promotion or lateral movement.
How to calculate it:
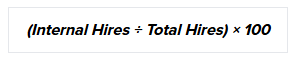
Internal mobility is a high-impact but undertracked ROI lever. It improves retention and reduces the cost of external hiring, cutting recruitment spend, ramp time, and mis-hire risk. Higher internal fill rates lower planning costs while strengthening workforce stability.
11. Time-to-Productivity for New Hires
What it is: The time it takes a new hire to reach full performance in their role.
How to calculate it: Defined by role-specific performance milestones (e.g., first closed deal, first independent project delivered), measured from start date.
Hiring doesn’t create value until a new hire reaches full productivity. Longer ramp times carry ongoing costs and delay output, especially in fast-scaling teams. Reducing time-to-productivity directly improves ROI.
This metric is often missed due to cross-team dependency, but it’s what links hiring decisions to actual business impact. Tracking it closes the loop between headcount investment and output.
Also Read: Top Workforce Compliance and Optimization Tools
Now that you have your 11 metrics, here's how to build the framework that tracks them.
Step-by-Step Process to Build a Workforce Planning ROI Framework
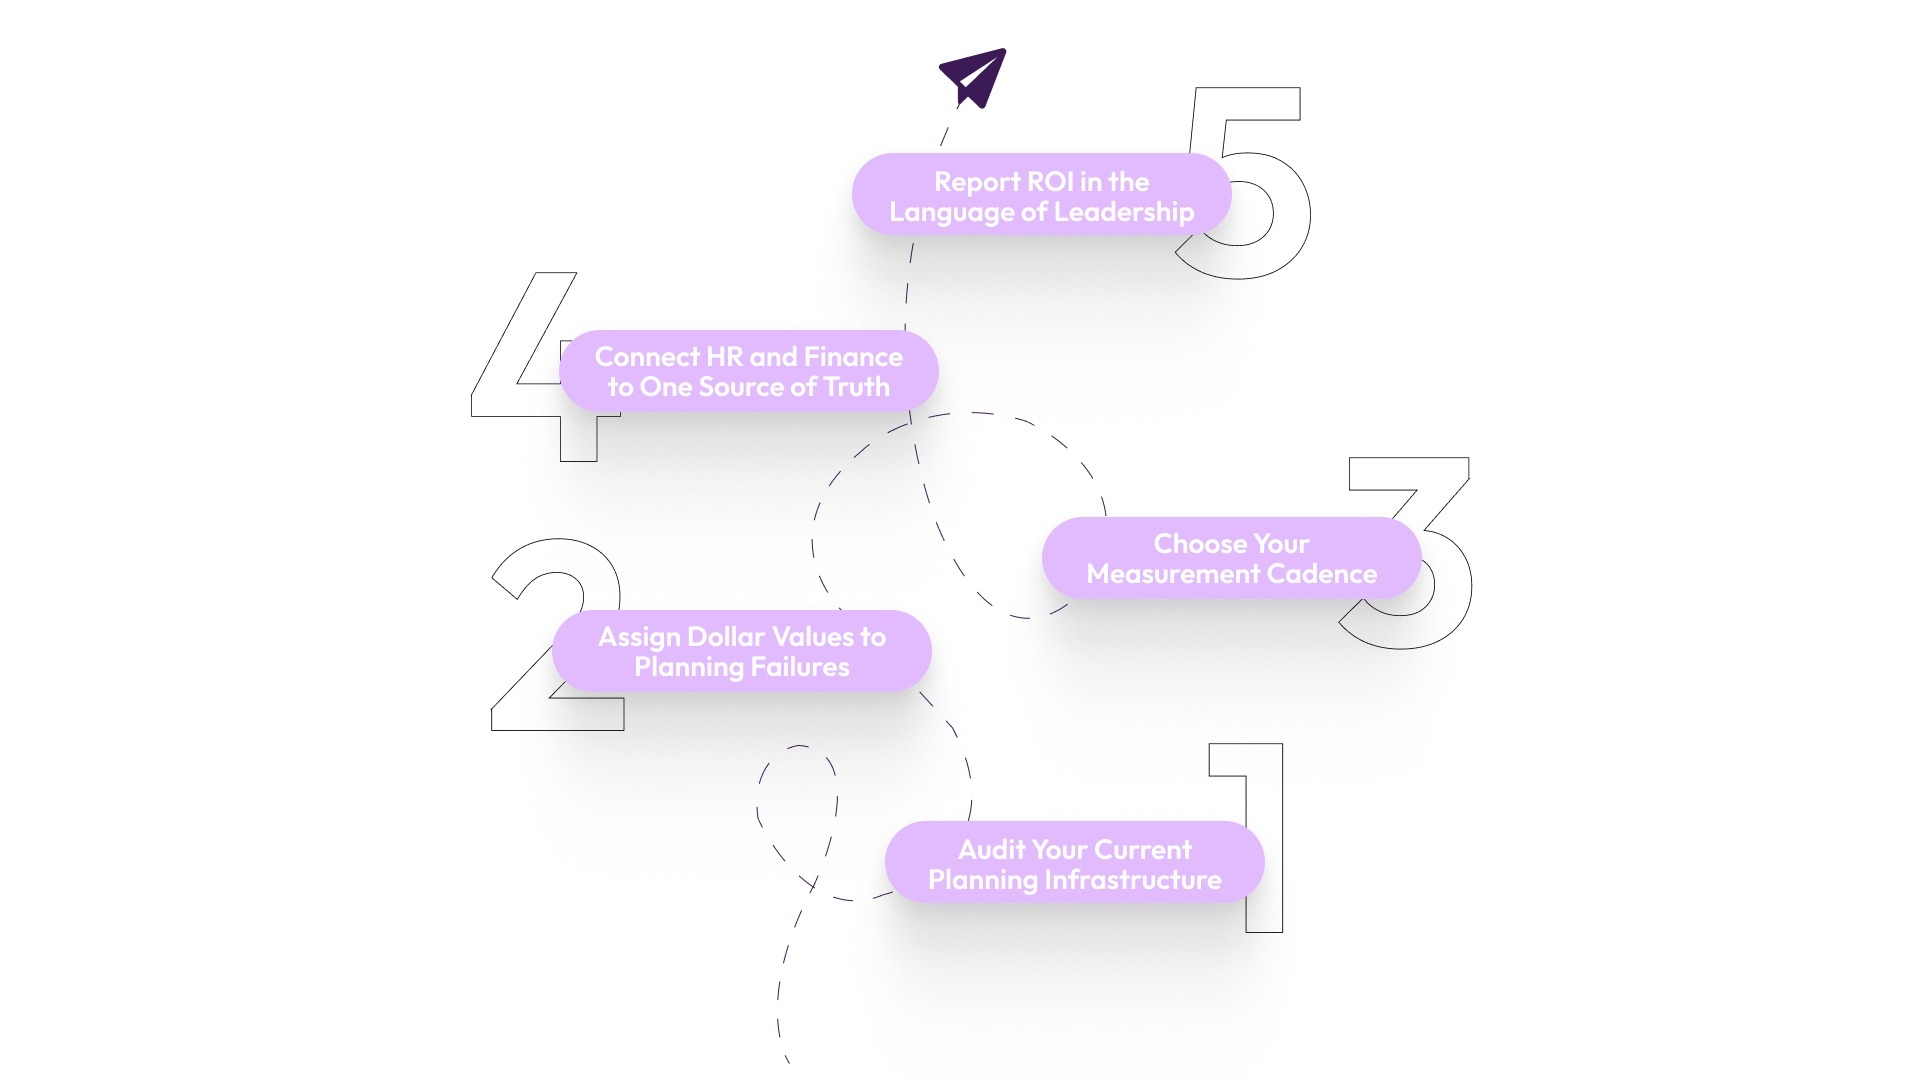
A metric without a process is just a number. Here's how to build the structure around these 11 metrics so they actually change how you plan.
Step 1: Audit Your Current Planning Infrastructure
Before you can measure ROI, you need to know what you're working with. Run a simple audit: Can you answer these six questions right now, without opening three different tools?
- What is your headcount varianfor planninglan this quarter?
- How long did your last comp cycle take, start to finish?
- What is your current pay equity gap rate?
- How many headcount requests are pending approval, and for how long?
- What is your offer acceptance rate over the last six months?
- What is your departmental attrition rate for the last two quarters?
If you can't answer two or more of these, your planning data is fragmented. That's your baseline. Now you know exactly what to fix.
Step 2: Assign Dollar Values to Planning Failures
Every gap in your audit has a dollar value. Map them out:
- Cost of delayed headcount approval = weeks delayed × weekly revenue impact of the unfilled role
- Cost of comp cycle errors = number of corrections made × average HR hours per correction × fully-loaded hourly rate
- Cost of attrition from pay equity gaps = number of employees at risk × average replacement cost (0.5–2x annual salary per SHRM)
This step is what turns a planning audit into a CFO-ready business case. It shows the cost of doing nothing.
Step 3: Choose Your Measurement Cadence
Not every metric needs to be tracked monthly. Set a cadence that matches how fast your organization moves:
- Weekly: Headcount approval cycle time, open roles vs. plan
- Monthly: Compensation budget alignment, offer acceptance rate
- Quarterly: Headcount variance to plan, attrition by department, revenue per employee
- Annually: Pay equity gap rate, internal mobility rate, time-to-productivity
A consistent cadence beats an accurate-but-irregular one.
Step 4: Connect HR and Finance to One Source of Truth
This is where most planning breaks down. When HR and Finance operate on different data sets, alignment becomes reactive, and decisions lose credibility.
CandorIQ unifies comp cycles, headcount planning, pay bands, and workforce reporting into a single system. Both teams work from the same live data, eliminating version conflicts and giving real-time visibility into budget impact and hiring decisions.
Instead of reconciling after the fact, HR and Finance plan, approve, and forecast together, with a clear, shared view of how each decision affects overall outcomes.
Step 5: Report ROI in the Language of Leadership
Metrics only matter if stakeholders can act on them. The value lies in how you frame them.
- CFOs: Budget adherence, cost avoidance, and spend predictability.
- CPOs: Attrition control, pay equity progress, and headcount efficiency.
- People Ops: Cycle time, approval speed, and data accuracy.
A focused quarterly ROI report, covering key metrics, trend vs. last quarter, and quantified impact, aligns stakeholders and reinforces workforce planning as a strategic function.
Also Read: AI and the New Era of Workforce Management
How CandorIQ Helps You Maximize Workforce Planning ROI
For many fast-scaling HR and Finance teams, the barrier to measuring workforce planning ROI is fragmented infrastructure. Disconnected tools create inconsistent data, delayed decisions, and no reliable link between planning inputs and business outcomes.
CandorIQ addresses this by consolidating compensation and headcount planning into a single system of record. HR and Finance operate on shared, real-time data, enabling aligned planning, faster approvals, and consistent reporting.
What we enable in practice:
- Compensation & Pay Band Builder: Define and manage pay bands by role, location, and level with real-time visibility and audit-ready version control.
- Compensation Cycle Automation: Run merit and bonus cycles with structured approvals, rationale tracking, and live budget visibility, reducing cycle time significantly.
- Headcount Scenario Planning: Model hiring plans and compare scenarios against budget constraints before execution.
- Headcount Requests & Approvals: Standardize requests with embedded business context and automate approval workflows with system integrations.
- Workforce Management Dashboard: Monitor hiring, attrition, and workforce changes against plan in a single, configurable view.
- AI Agent: Analyze comp gaps, forecast needs, and model impact through natural language queries, no manual modeling required.
- Candidate Offer Transparency: Present complete compensation breakdowns, improving offer clarity, acceptance rates, and early retention.
With a unified platform, workforce planning metrics shift from retrospective reporting to continuous, real-time tracking.
If you're ready to stop measuring workforce planning ROI in spreadsheets and start measuring it in outcomes, explore CandorIQ and see how unified planning changes what's possible.
.png)
FAQs
1. What is the difference between workforce planning ROI and HR ROI?
HR ROI measures the return across all HR activities, including hiring, L&D, and engagement. Workforce planning ROI is narrower, focusing on returns from headcount forecasting, compensation decisions, and Finance–HR alignment. It evaluates planning effectiveness, not overall HR performance.
2. How often should US companies review workforce planning metrics?
Review high-velocity metrics like approval cycle time weekly. Track budget alignment and offer acceptance monthly. Assess attrition, revenue per employee, and headcount variance quarterly. Evaluate pay equity and internal mobility annually, typically during compensation planning cycles.
3. What’s the first metric a CPO should prioritize?
Start with the headcount plan vs. actuals variance. It’s simple, ties directly to Finance–HR alignment, and quickly builds leadership credibility. Once established, add compensation cycle time and pay equity gap rate to measure broader compensation planning effectiveness.
4. How do you calculate workforce planning ROI for a platform investment?
Compare pre- and post-implementation costs, including HR time, attrition, comp errors, and mis-hires. Assign monetary value to improvements like time saved, reduced attrition, and lower variance, then subtract platform costs to determine net ROI.
5. Is workforce planning ROI relevant for companies with fewer than 200 employees?
Yes. Smaller companies feel a greater impact from each hiring or compensation mistake. Losing even a few key employees significantly affects payroll and performance, making structured workforce planning and ROI tracking highly valuable at smaller scales.
Ready to modernize your workforce and compensation strategy?
See how CandorIQ brings workforce planning and compensation together with AI.