A Guide to Use Total Rewards Benchmarking Data in 2026
Learn how to use total rewards benchmarking data to build fair pay bands, close compensation gaps, and retain top talent, within an HR framework.

Even in 2026, most employers consistently fail to benchmark their pay against market standards. Only 24% of organizations clearly explain the purpose and design of their reward programs to employees. For growing organizations, this disconnect is a morale issue as well as a strategic risk.
Payscale has called 2026 "The Year of Strategic Alignment", where companies treat compensation as a top executive priority. That shift requires something most organizations currently lack: a robust, connected system for collecting, interpreting, and acting on total rewards benchmarking data.
This guide covers what total rewards benchmarking data includes and how you can build a fair compensation system using it.
Key Takeaways
- Total rewards benchmarking goes beyond salary. You need to evaluate base pay, bonuses, equity, benefits, and non-monetary rewards together to stay competitive and relevant in 2026.
- Most companies fail not due to a lack of data, but poor execution. Outdated benchmarks, siloed HR–Finance workflows, and over-reliance on spreadsheets lead to inconsistent and ineffective compensation decisions.
- A structured approach makes benchmarking actionable. Use relevant, real-time data, segment by role/level/location, build pay bands, and track compa-ratio to maintain pay equity and market alignment.
- Benchmarking must be continuous and transparent. Regular updates and clear communication with employees improve trust, retention, and decision-making across hiring and compensation cycles.
- Tools like CandorIQ turn data into decisions. By connecting benchmarking, pay bands, offers, and workforce planning in one system, you can build a scalable, fair, and strategic compensation framework.

What is Total Rewards Benchmarking Data?
Total rewards benchmarking data is the collection of compensation and benefits intelligence gathered from external organizations and market surveys, which your HR teams use to compare against their own pay structures, benefits offerings, and equity grants.
Most salary benchmarking exercises look only at base pay. But employees experience their compensation as a complete package, and so do candidates deciding whether to accept your offer. A truly competitive total rewards strategy must benchmark across all five pillars:
- Base Pay: Fixed salary for a given role, level, and geography
- Variable Pay: Bonuses, commissions, and performance incentives
- Equity: Stock options, RSUs, and new hire or refresh grants
- Benefits: Health insurance, retirement contributions, PTO, parental leave, and wellness stipends
- Non-Monetary Rewards: Career development, flexible work, recognition programmes, and learning budgets
Remember, an effective total rewards strategy aligns with the organization's culture, business objectives, and workforce demographics. Benchmarking only one dimension of this produces a distorted picture of how competitive you actually are. How? Let’s see in the next section.
Why Most Companies Are Still Getting Benchmarking Wrong in 2026
The benchmarking data problem is not a shortage of information. Most organizations fail to turn benchmarking data into clear, actionable decisions. As a result, compensation stays disconnected from hiring, budgeting, and retention strategies.
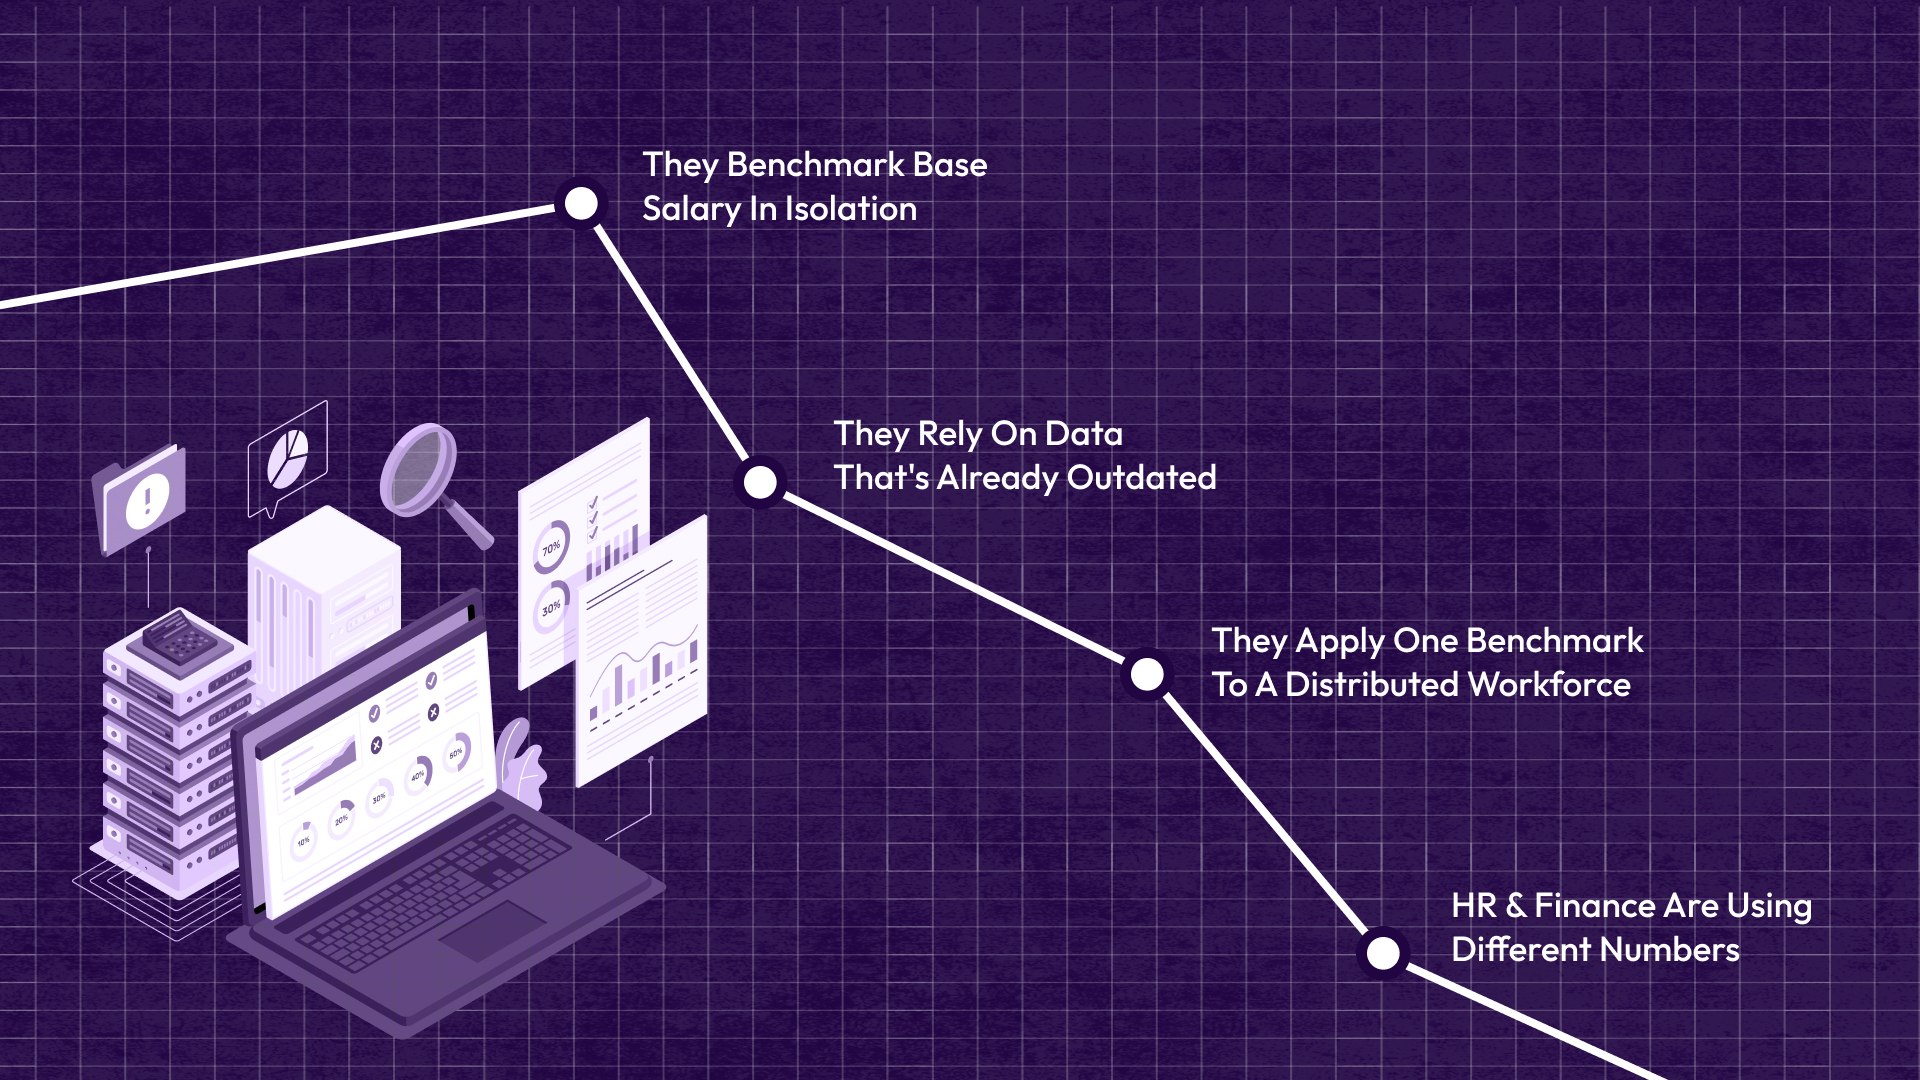
Here are the four most common failure points:
1. They Benchmark Base Salary In Isolation
Salary is one of the biggest factors in career decisions. Most employees say it drives their decision to look for a new role. But candidates and employees evaluate total compensation, not just salary. If your benchmarking doesn't account for the full rewards package, your pay bands will always be an incomplete picture.
2. They Rely On Data That's Already Outdated
Traditional compensation surveys are typically published annually, which means by the time your HR team receives, analyses, and implements the findings, the market may have moved.
In fast-moving sectors like SaaS and fintech, salary data can shift meaningfully in a single quarter. Only real-time benchmarking tools like CandorIQ, which refresh continuously, solve this problem in ways static surveys cannot.
3. They Apply One Benchmark To A Distributed Workforce
Only 18% of organizations require knowledge workers to be fully on-site. The remaining operate hybrid or fully remote workforces. This means pay bands built on a single national benchmark are almost certainly wrong for at least some of their team. Geo-adjusted compensation has become a foundation for distributed teams.
4. HR And Finance Are Using Different Numbers
This is perhaps the most damaging failure of all. When HR builds pay bands from one dataset, and Finance models headcount costs from another, compensation decisions lose their coherence. Offers get made outside the band. Merit budgets are exhausted before the cycle ends.
Also Read: A Comprehensive Guide to Startup Compensation and Equity
So, the root cause is almost always a disconnected process, not a lack of data. But how can you make it right?
How to Use Total Rewards Benchmarking Data Effectively: A 5-Step Framework
Here is a proven step-by-step strategy that HR and Finance teams at high-growth organizations can use to turn benchmarking data into strategic compensation decisions.
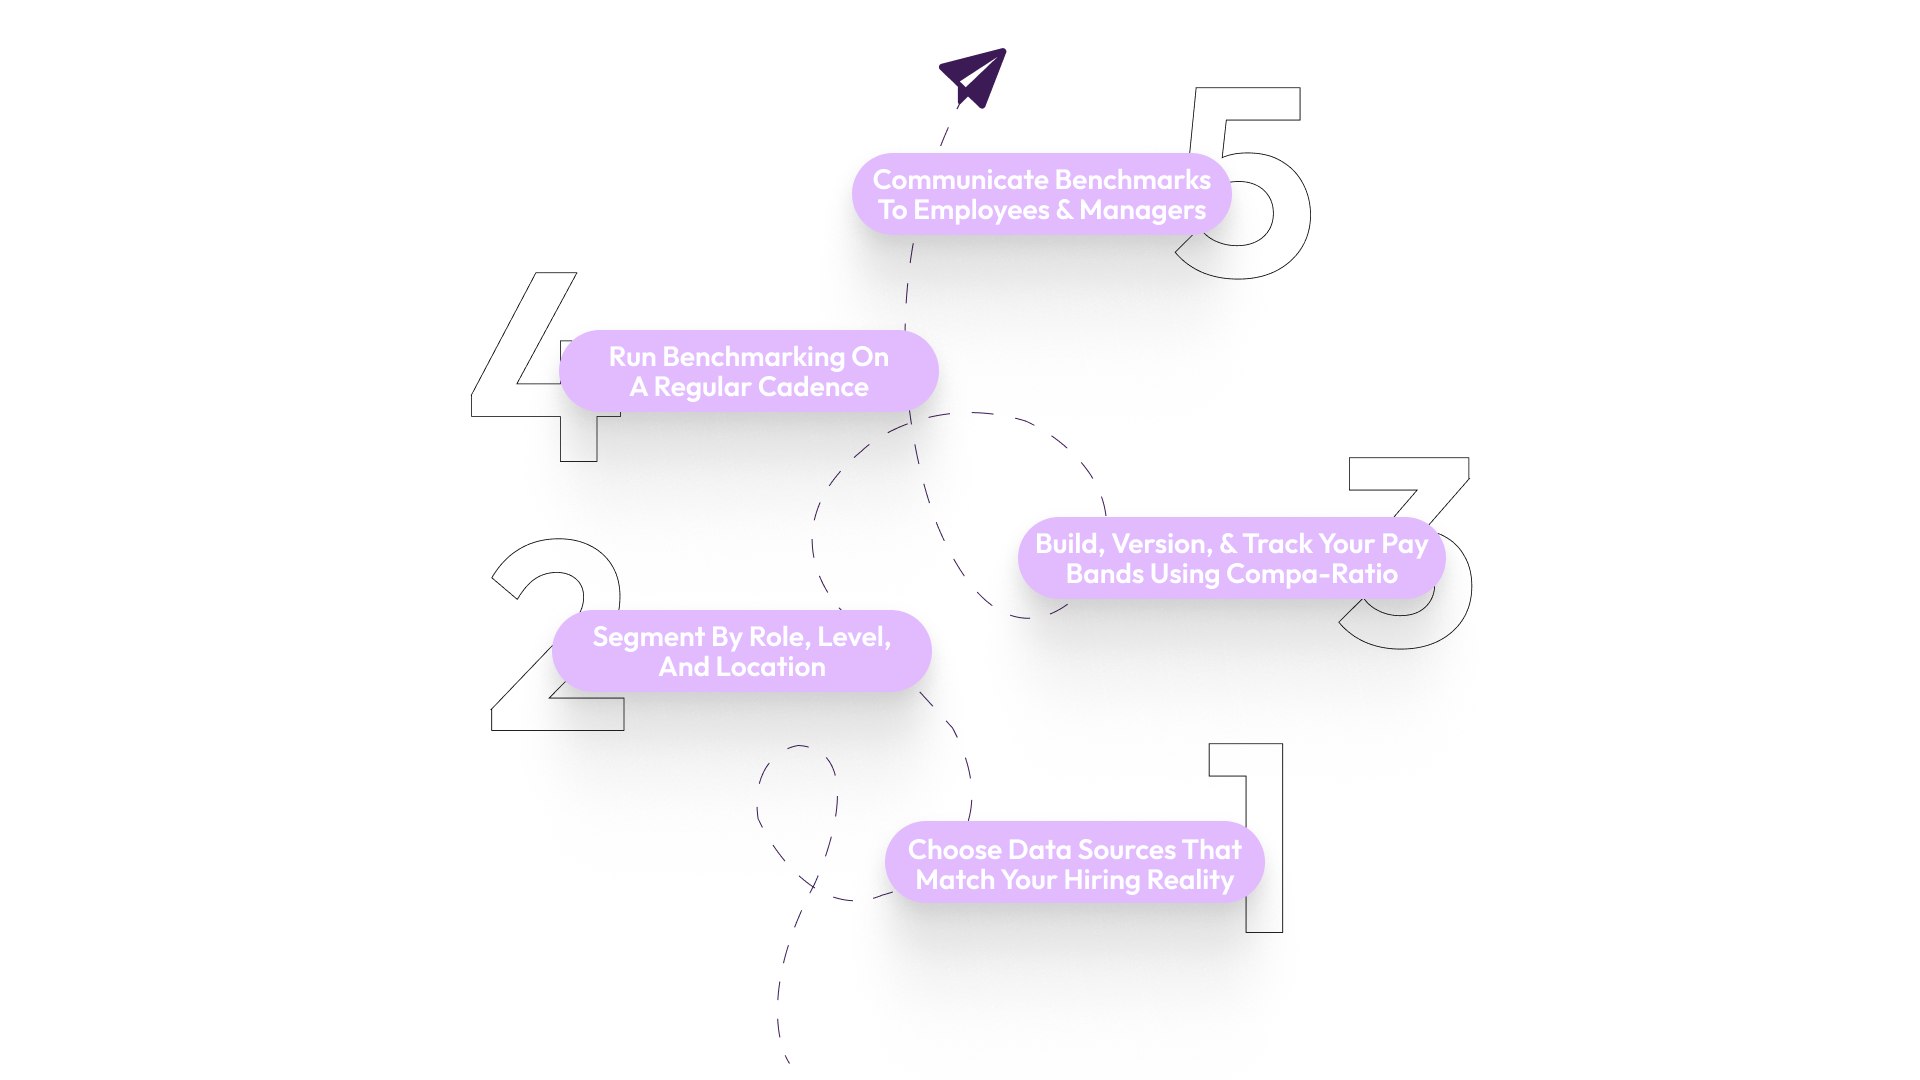
Step 1: Choose Data Sources That Match Your Hiring Reality
Not all benchmark datasets are equal, and the right source depends on your industry, geography, and company stage.
Key criteria when evaluating a data source:
- Recency: If the data is refreshed annually, quarterly, or in real time?
- Peer Relevance: Does it cover your industry, company stage, and geographic footprint?
- Completeness: Does it include equity, benefits, and variable pay, or only base salary?
- Methodology: Is the data employer-reported, employee-reported, or algorithmically modelled? Each has different reliability implications.
For broader industries, Mercer's Total Remuneration Survey data offers global consistency across nearly every role family.
Step 2: Segment By Role, Level, And Location
A benchmark is nearly irrelevant without the role or level context. Before you build a single pay band, ensure your benchmarking data is segmented across three dimensions:
- Job family and level.
- Geographic location,
- Company size or funding stage.
Miss any one of these, and you're benchmarking in the wrong direction.
Step 3: Build, Version, And Track Your Pay Bands Using Compa-Ratio
Once you have segmented benchmark data, translate it into pay bands that hiring managers, recruiters, and HRBPs can actually use. Each pay band should define a minimum, midpoint, and maximum for a given role and level, with clear guidance on where new hires, promotions, and high performers sit within the range.
Once your bands are live, track them using compa-ratio, one of the most important and underused metrics in compensation management.
Compa-ratio is calculated as:
Compa-Ratio = (Employee's Actual Salary ÷ Pay Band Midpoint) × 100
- A compa-ratio of 100 means the employee is paid exactly at the midpoint.
- A ratio between 80 and 120 is typically considered healthy.
- Employees consistently below 80 may be underpaid relative to the market, a retention and equity risk.
- Employees above 120 may be above band, signaling either a compression issue or a band that needs updating.
When you track compa-ratio by department, tenure, gender, or demographic group, you turn a single metric into a pay equity audit. It reveals whether certain managers systematically underpay their teams, whether particular job families are drifting out of market, and whether your benchmarking is actually producing equitable outcomes.
Step 4: Run Benchmarking On A Regular Cadence
Most organizations run compensation benchmarking annually. For roles with high turnover or scarce talent, bi-annual or quarterly reviews are increasingly necessary.
Benchmarking shouldn't be a once-a-year event that feeds one merit cycle. It should be a living input into every major people decision, such as new hire offers, promotion recommendations, retention conversations, and headcount plans.
Step 5: Communicate Benchmarks To Employees And Managers
Benchmarking data that lives only in a spreadsheet does nothing for trust or retention. Employees who understand how their pay is determined, and that it is grounded in real market data, are significantly more likely to feel fairly treated.
Modern compensation tools like CandorIQ help you consolidate multiple tools into a unified system for managing pay bands, compensation cycles, headcount forecasting, and offer workflows, to keep your total rewards strategy transparent.
Transparency around total rewards benchmarking builds trust, reduces the volume of reactive pay conversations, and directly supports your employer brand.
Also Read: Creating a Total Rewards Strategy for a Multigenerational Workforce
A sound process gets you most of the way there. But the reason most teams struggle to sustain is the tools they're trying to run the process through. That's where the conversation around infrastructure becomes unavoidable.
What a Modern Compensation Platform Does Differently
Most HR and Finance teams end up dumping benchmarking data into spreadsheets, where it quickly becomes outdated and unused.
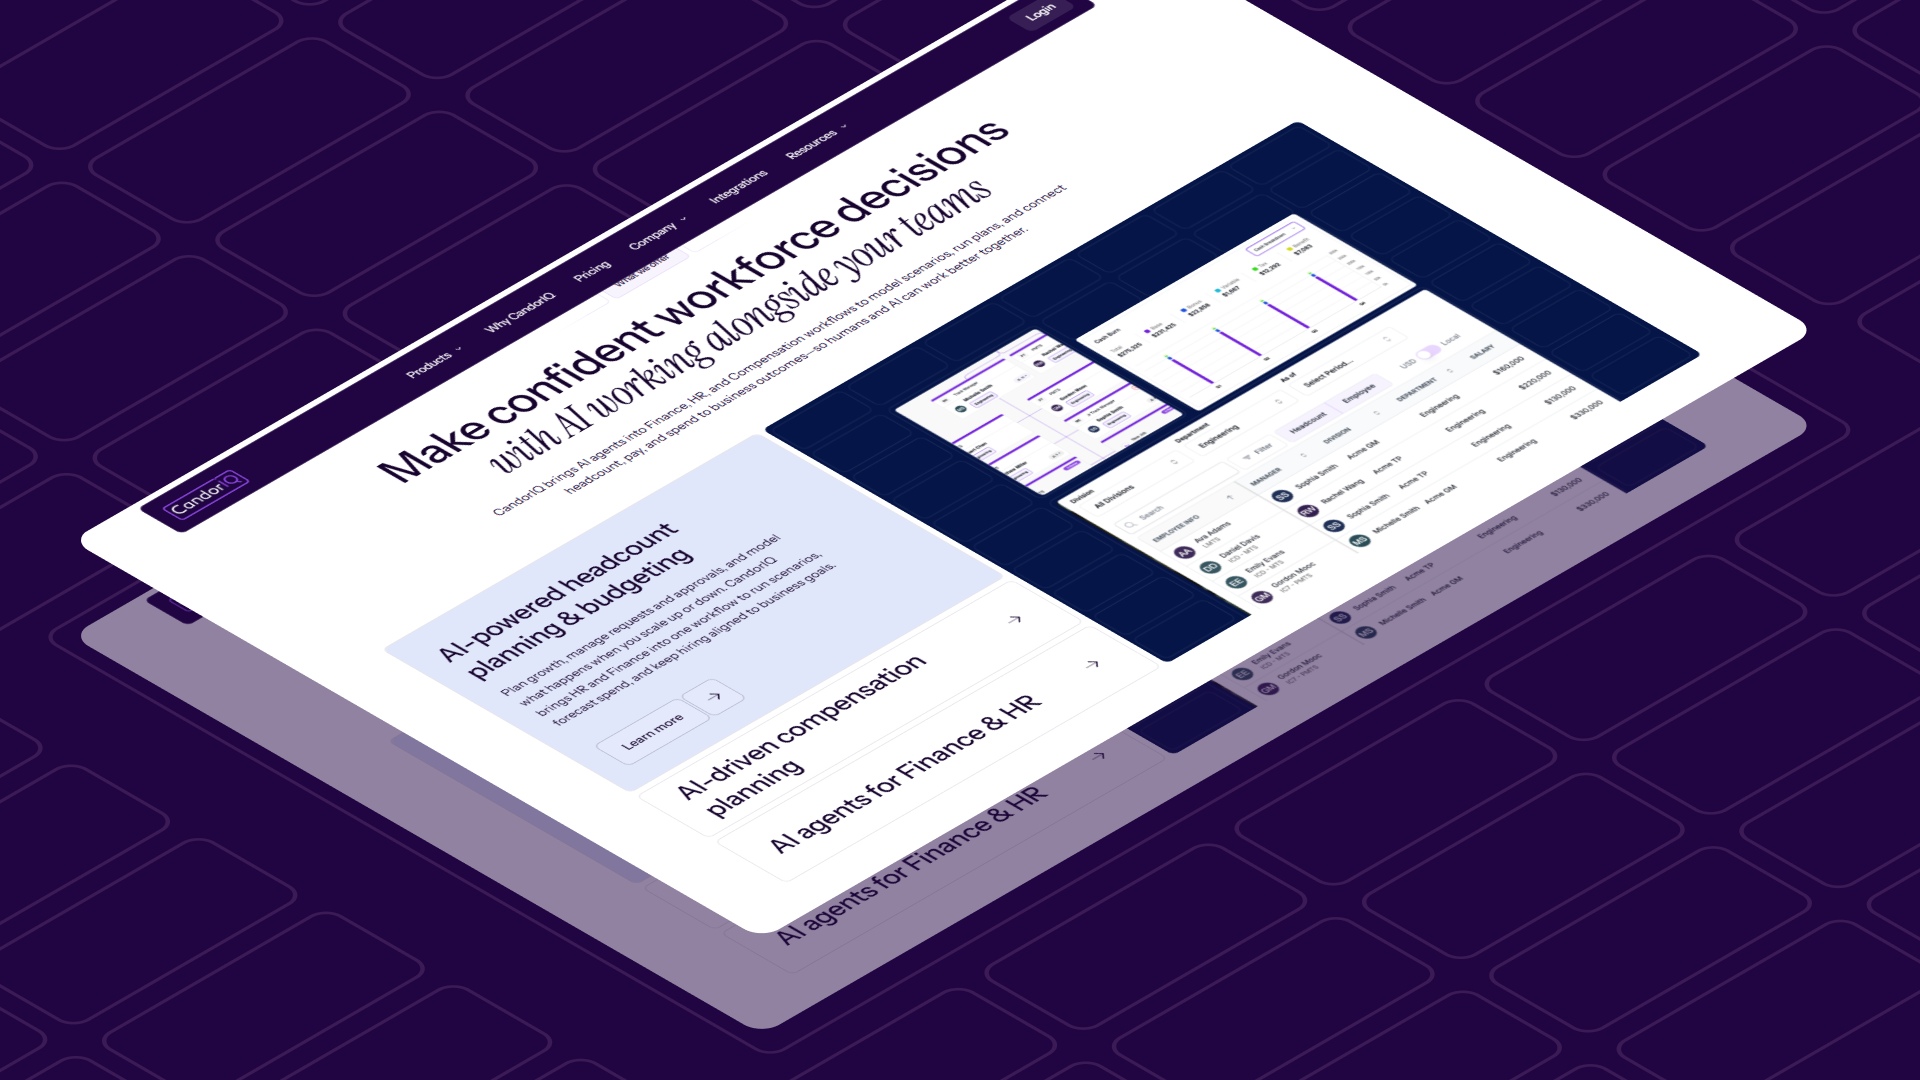
CandorIQ is a unified compensation and headcount planning platform that connects every stage of the total rewards lifecycle, from benchmarking and pay band design through to compensation cycle execution, offer management, and workforce planning, in a single system that HR and Finance use together.
It offers:
- Compensation & Pay Band Builder: Define pay bands by level, role, and location using live benchmark datasets. Apply geo-adjusted salary modeling in real time, visualize pay distribution across your workforce, and maintain full version control so every band decision has an audit trail.
- Compensation Cycle Management: Automate merit and bonus reviews with built-in approval logic, in-platform collaboration, and real-time budget tracking by department. Cut cycle time from weeks to days, with executive visibility into budget utilisation at every stage.
- Candidate Offer Workflows: Give candidates a complete view of their total compensation, salary, equity, bonus, and benefits, with future-value equity modeling built in. Structured, consistent, and grounded in the same pay bands used internally.
- Headcount Scenario Planning: Model future org structures and see their financial implications before a single hire is made. Finance and People Ops collaborate on the same plan, toggle between hiring scenarios, and measure every decision against budget thresholds in real time.
- AII Agent: Ask natural language questions to surface pay equity gaps, forecast the cost impact of band changes, or identify which roles are drifting below market.
For HR and Finance teams at growth-stage companies who are tired of making high-stakes compensation decisions on infrastructure that was never designed to support them, CandorIQ is the solution to your effective total rewards benchmarking data and your compensation workflow.
The Bottom Line
In 2026, as salary budgets tighten, pay transparency obligations expand, and talent competition remains fierce, total rewards benchmarking data has become mandatory.
The teams that succeed follow a clear pattern. You define a compensation philosophy that guides what you benchmark against. You evaluate the entire rewards package regularly. You bring Finance in from day one. You track compa-ratio to catch pay gaps early, before they turn into retention issues.
And most importantly, you use a system that connects benchmarking data to every decision, from pay bands and offers to merit cycles and compliance.
Ready to connect your total rewards benchmarking data to a compensation workflow that actually works? Request a demo now.

FAQs
What is the difference between salary benchmarking and total rewards benchmarking?
Salary benchmarking focuses exclusively on base pay, comparing your salary range to market data for equivalent roles. Total rewards benchmarking takes a broader view, accounting for the full value of what employees receive: base pay, equity, variable compensation, benefits, and non-monetary rewards. The distinction matters because employees and candidates evaluate total packages when making career decisions, not individual salary lines.
How often should you benchmark total rewards?
For most roles, an annual full benchmarking review is a reasonable baseline. For high-demand or high-turnover roles, bi-annual or even quarterly spot checks are increasingly warranted in fast-moving markets. The rule of thumb: if a role's market rate can shift significantly in 6–9 months (and in tech, it can), your benchmarking cadence should reflect that.
Which percentile should I target in compensation benchmarking?
That depends on your compensation philosophy. The 50th percentile (market median) is the most common position and is appropriate for most roles in most organizations. The 75th percentile makes sense for roles where talent is scarce or where performance differentiation is high. The 25th–40th percentile can work when it's deliberately offset by strong equity, mission alignment, or career development — but only if employees understand and value the trade-off.
Do pay transparency laws require benchmarking data?
Laws in states like Colorado, California, and New York require salary ranges in job postings. The EU Pay Transparency Directive requires employers to demonstrate equal pay for equal work. Neither law mandates a specific benchmarking methodology. But if your salary ranges are challenged by a candidate, an employee, or a regulator, having market benchmarking data behind them is the only defensible foundation. Publishing ranges without benchmarking to support them creates more risk, not less.
What's the best benchmarking data source for a US-based tech company?
Radford (Aon) remains the gold standard for large technology organizations with complex role architectures. For earlier-stage and growth companies, Payscale, Pave, and Levels.fyi offer strong coverage with lower entry points. The best source isn't universal — it's the one that most closely reflects your peer group by industry, stage, geography, and role family. Many mature comp teams use two sources and triangulate between them.
Ready to modernize your workforce and compensation strategy?
See how CandorIQ brings workforce planning and compensation together with AI.