Top 10 HR Department KPI Examples for Workforce Planning (2026)
Learn how to use 10 HR department KPI examples, formulas, and benchmarks to measure hiring, cost, and performance for better workforce planning decisions.
.jpg)

HR teams are not short on data, but turning that data into clear workforce decisions is where things break. You are tracking Time to Fill, Cost per Hire, attrition, and engagement, yet hiring slows down, budgets drift, and it is still unclear what to adjust.
This is where most Chief People Officers get stuck. The data exists, but it does not connect to hiring plans, compensation decisions, or workforce allocation in a way that drives action.
The impact is real. Some reports show that organizations that effectively meet workplace needs see 91% job satisfaction, which is directly tied to how well workforce decisions are made and executed.
This guide breaks down the HR KPIs that matter, how to interpret them in context, and how to connect them to hiring, compensation, and workforce planning decisions so you can act faster and with confidence.
Key Takeaways
- Pinpoint why hiring is slowing down, or costs are increasing, and take corrective action without relying on fragmented reports.
- Identify exactly which teams, roles, or managers are driving attrition, low performance, or budget inefficiencies.
- Translate KPI changes into clear decisions, so you can adjust hiring plans, compensation, or team structure with confidence.
- Align hiring, compensation, and workforce data into one view, reducing delays and improving decision speed across HR and Finance.
- Move from reactive reporting to proactive workforce planning, so issues are addressed before they impact performance or budgets.
What Are HR KPIs and Why Do They Matter?
HR KPIs are a focused set of 5–10 key metrics that show how your people's decisions are actually impacting the business. Unlike regular HR data, KPIs highlight what is working, what is slipping, and where action is needed, so you are not relying on guesswork.
Each characteristic makes KPIs useful for real decision-making, not just reporting:
- Direct Business Link: Connects HR data to outcomes like workforce cost, productivity, and team performance, making it easier to explain impact in leadership discussions.
- Clear Ownership: Every KPI has a responsible owner, so when numbers shift, someone is accountable for investigating and fixing the issue.
- Consistent Tracking: Uses the same method over time, so you can compare trends across teams, roles, or quarters without confusion.
- Drill-Down Insights: Let's you break data down by manager, location, or tenure to understand what is actually driving changes.
- Early Warning Signals: Surface patterns like rising attrition or low engagement early, giving you time to act before they affect performance.
HR KPIs give you a clear, structured way to understand workforce performance and take action with confidence instead of reacting after problems show up.

Top 10 HR Department KPI Examples That Drive Hiring and Workforce Decisions
HR KPIs highlight where hiring, cost, performance, and retention decisions start to break. When tracked together, they show which teams are slowing down, where budgets are leaking, and how workforce decisions are impacting output, helping leaders identify issues early and act with clarity.
A quick look at the top 10 HR department KPI examples and what they signal:
Each KPI points to a specific issue, but the real question is what it tells you to change and where to act next.
1. Time to Fill (TTF)
Time to Fill measures how long it takes to close a role from approval to offer acceptance, helping you track hiring speed across teams.
How you calculate time to fill: TTF = Total days to fill roles ÷ Number of roles filled
Longer timelines usually signal bottlenecks in sourcing, screening, or approvals. For example, if TTF for sales roles increases from 30 to 60 days, teams often adjust sourcing channels or simplify interview stages.
Tracking this helps prevent delays in team productivity and revenue impact. Most teams aim to keep this within role-specific benchmarks.
2. Cost Per Hire (CPH)
Cost Per Hire tracks the total cost of recruiting divided by the number of hires, giving visibility into hiring efficiency and budget usage.
How you calculate cost per hire: CPH = Total recruiting costs ÷ Number of hires
Rising costs often indicate over-reliance on agencies or inefficient sourcing. For example, if CPH increases by 30%, teams typically shift to referrals or internal sourcing to reduce spend.
Monitoring this helps control hiring budgets without compromising quality. Benchmarks vary by role and hiring model.
3. Quality of Hire (QoH)
Quality of Hire measures how well new employees perform and stay, using indicators like performance ratings, retention, and manager feedback.
How you calculate quality of hire: QoH = (Performance score + Retention rate + Manager satisfaction) ÷ 3
Low quality of hire shows up as early exits or underperformance. For example, if multiple hires leave within 3 months, teams often revisit screening criteria or role expectations.
Tracking this helps ensure hiring drives long-term performance, not short-term headcount filling.
4. Employee Net Promoter Score (eNPS)
eNPS measures how likely employees are to recommend the company as a place to work, using a scale from 0 to 10.
How you calculate eNPS: eNPS = % Promoters − % Detractors
A drop in eNPS often signals declining engagement or morale. For example, if one department’s score drops sharply, HR teams usually investigate manager effectiveness or workload issues.
Tracking this regularly helps identify engagement risks before they impact retention and performance.
5. Voluntary Turnover Rate
Voluntary turnover rate measures the percentage of employees who leave by choice over a given period, highlighting retention risks.
How you calculate voluntary turnover: Turnover (%) = (Voluntary exits ÷ Average headcount) × 100
Spikes usually indicate issues in compensation, management, or career growth. For example, if turnover rises in engineering, teams often review pay competitiveness and promotion pathways.
Tracking this helps reduce replacement costs and maintain workforce stability over time.
6. Revenue per Employee
Revenue per Employee measures total revenue generated per employee, showing how effectively your workforce drives business output.
How you calculate revenue per employee: Revenue per Employee = Total revenue ÷ Total employees
If headcount grows without a matching increase in revenue, productivity may be misaligned. For example, teams often reassess hiring plans or role prioritization in such cases.
This KPI helps connect hiring decisions directly to business performance.
7. Training Completion Rate
Training Completion Rate measures the percentage of employees who complete assigned training programs, indicating adoption of learning initiatives.
How you calculate training completion rate: Completion Rate (%) = (Completed trainings ÷ Assigned trainings) × 100
Low completion rates often mean training is not relevant or accessible. For example, if only 40% complete onboarding training, teams typically redesign content or delivery.
Tracking this helps ensure training efforts actually improve workforce capability.
8. Diversity Representation Rate
Diversity Representation Rate tracks workforce composition across groups, such as gender or ethnicity, at different levels of the organization.
How you calculate diversity representation: Representation (%) = (Group count ÷ Total workforce) × 100
Gaps in representation often show up in hiring pipelines or leadership roles. For example, low diversity in leadership may lead teams to adjust sourcing or promotion practices.
Tracking this helps ensure progress toward measurable diversity and inclusion goals.
9. Internal Promotion Rate
Internal Promotion Rate measures the percentage of roles filled by existing employees, reflecting internal mobility and career growth.
How you calculate internal promotion rate: Promotion Rate (%) = (Internal hires ÷ Total roles filled) × 100
Low rates often indicate weak development or succession planning. For example, if most leadership roles are filled externally, teams usually invest in internal talent programs.
Tracking this helps retain high performers and reduce external hiring dependency.
10. HR-to-Employee Ratio
HR-to-Employee Ratio measures how many HR team members support the total workforce, indicating HR capacity and coverage.
How you calculate HR-to-employee ratio: Ratio = Number of HR staff ÷ Total employees
A low ratio can lead to slow support and missed issues, while a high ratio may indicate inefficiency. For example, one HR partner supporting 300 employees may struggle with response times.
Tracking this helps balance HR capacity with workforce needs as the company scales.
Why These KPIs Often Fail to Drive Better Decisions
These KPIs are meant to guide decisions, but in most teams, they are tracked in isolation.
Hiring slows, costs rise, and retention issues appear, yet it remains unclear what is causing the problem or what to adjust. The issue is not the KPIs; it is how they are used.

How to Identify Where Workforce Problems Are Coming From
Workforce issues rarely show up in one metric. They appear as patterns across hiring speed, cost, performance, and retention. The key is to read KPIs together, so you can isolate where the problem starts and what needs to change.
Use KPI patterns to pinpoint the source of workforce issues:
- Hiring Bottlenecks: Rising Time to Fill with stable Cost per Hire usually points to slow approvals or inefficient interview stages, not sourcing issues
- Cost Inefficiencies: Increasing Cost per Hire without improvement in Quality of Hire signals wasted spend across channels or poor role targeting
- Retention Risks: High turnover combined with declining eNPS often indicates compensation gaps or manager-level issues in specific teams
- Productivity Gaps: Headcount growth with flat Revenue per Employee shows misaligned hiring or overstaffing in low-impact roles
- Capability Gaps: Low Training Completion with declining performance highlights skill gaps that are not being addressed effectively
Reading KPIs in combination makes it easier to isolate root causes, prioritize fixes, and take targeted action instead of reacting to isolated metrics.
If KPI patterns point to hiring delays or cost inefficiencies, a structured approach like the ultimate guide to headcount analysis and workforce planning becomes relevant.
How to Choose HR KPIs That Support Better Decision-Making
Choosing HR KPIs means selecting a small set of metrics that directly guide workforce decisions across hiring, cost, and performance. Instead of tracking everything, focus on signals that show where action is needed, who owns it, and how outcomes change over specific time periods.
Each principle below ensures KPIs are decision-ready, not just tracked:
- Link To Business Outcomes: Select KPIs like Revenue per Employee or Cost per Hire that directly influence budget, hiring plans, and performance targets.
- Define Ownership Clearly: Assign each KPI to a specific leader so when numbers shift, accountability and follow-up actions are immediate.
- Track At Team Level: Break KPIs by function, role, or manager to identify where issues originate instead of relying on company-wide averages.
- Set Review Frequency: Monitor critical KPIs weekly or monthly so changes are caught early and decisions are made before impact compounds.
- Limit To Critical Few: Focus on 5–10 KPIs per function to avoid noise and ensure each metric drives a clear action or adjustment.
Selecting the right KPIs ensures every metric you track leads to a clear decision, helping you act faster, prioritize correctly, and manage workforce performance with precision.
If compensation gaps or attrition trends are showing up in your KPIs, the next step is understanding measuring key total rewards metrics for hr success.
Common HR KPI Mistakes That Limit Business Impact
HR KPI mistakes usually come from tracking metrics without clear ownership, inconsistent definitions, or no link to workforce decisions. This leads to delayed actions, misaligned hiring plans, and poor cost control, even when data is available. Fixing these gaps ensures KPIs actually influence outcomes, not just reporting.
Common mistakes that reduce the effectiveness of HR KPIs and how they impact decisions:
Avoiding these mistakes ensures KPIs remain actionable, consistent, and tied to real workforce decisions, helping HR leaders move faster and maintain control over performance and cost outcomes.
When compensation starts influencing turnover or offer acceptance, it becomes important to understand how to measure compensation effectiveness for hr management.
How CandorIQ Helps You Connect HR KPIs to Workforce Planning
CandorIQ turns HR KPIs into clear workforce decisions by connecting hiring, compensation, and budget data in one system. Instead of tracking metrics in isolation, you see how changes impact headcount plans, costs, and approvals in real time, allowing faster, more confident decisions across HR and Finance.
CandorIQ products that directly convert KPI insights into workforce planning actions:
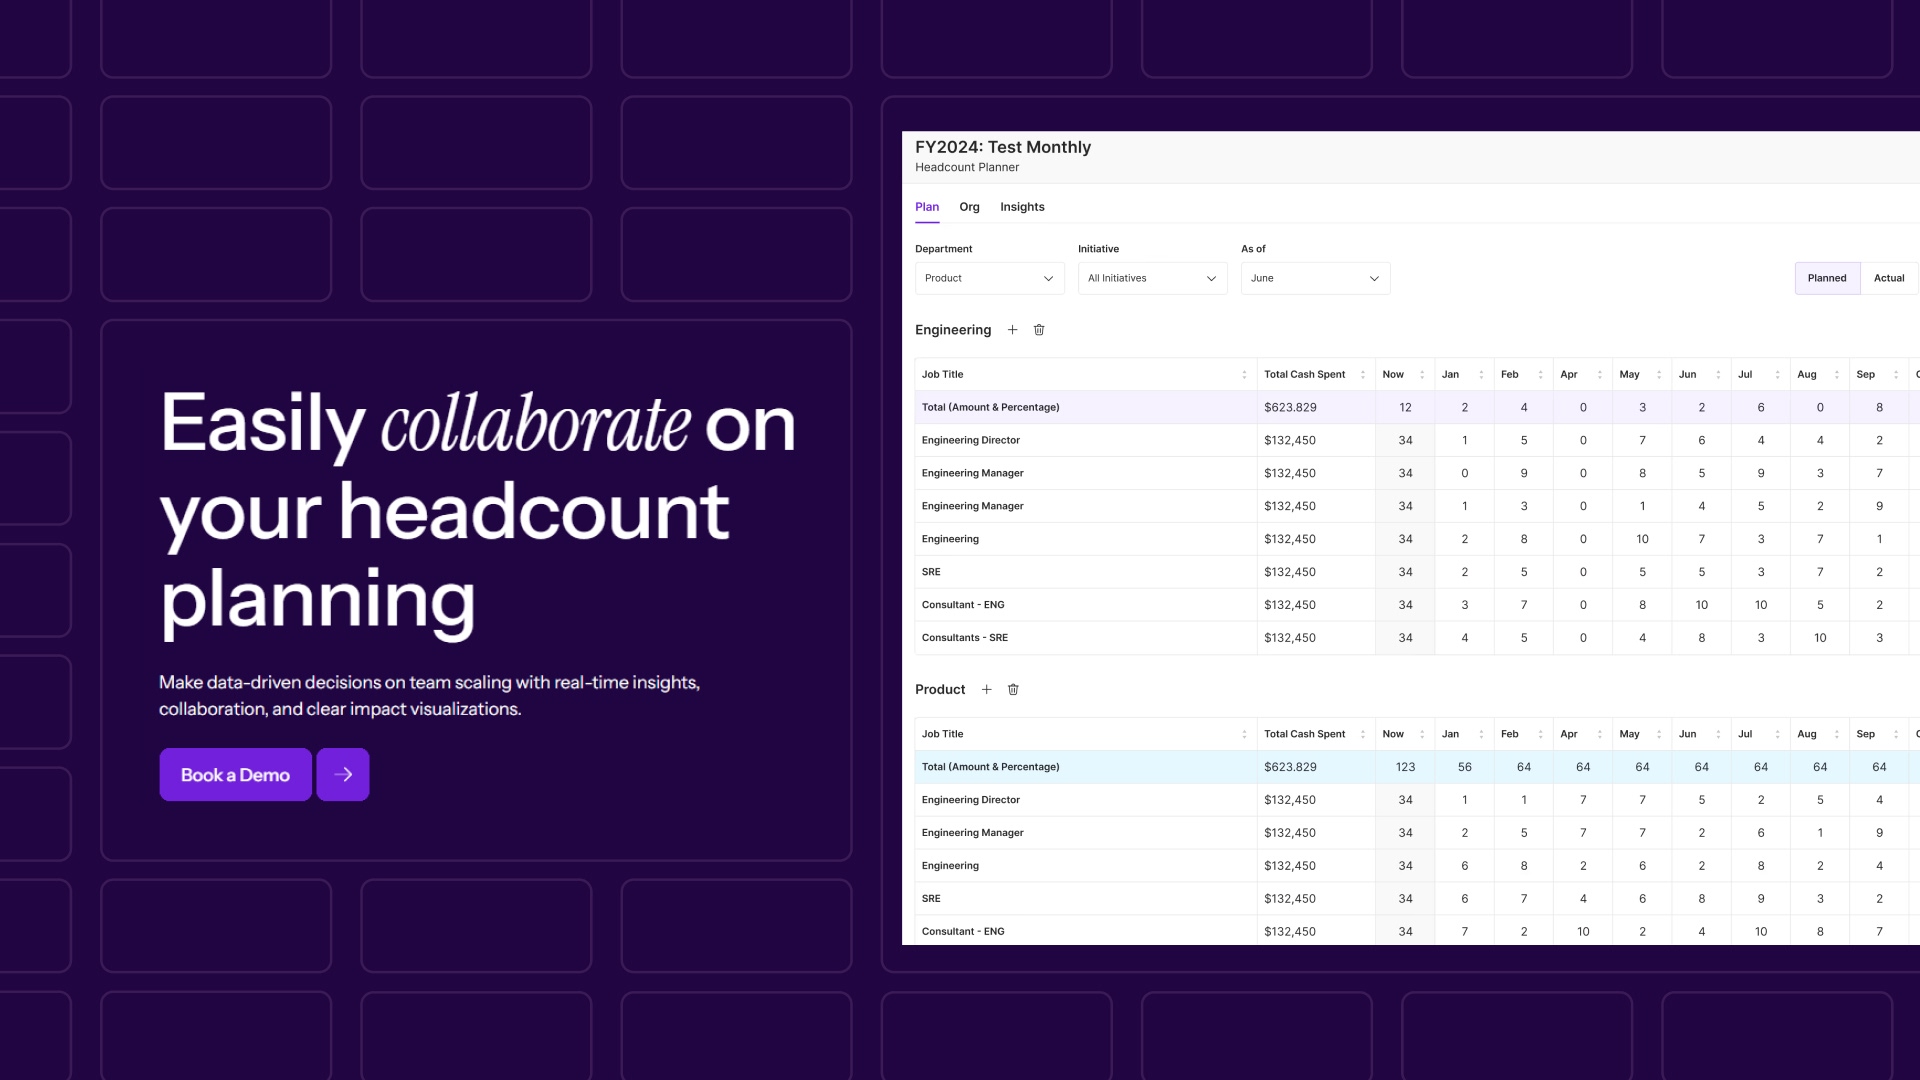
- Model hiring plans and cost impact instantly, so KPI changes directly inform whether to scale, pause, or reallocate roles. This helps teams avoid reactive hiring and make workforce decisions based on real budget impact.
- Headcount Requests And Approvals:
.jpg)
- Connect KPI signals to structured hiring workflows with clear budget and role visibility. This reduces approval delays and ensures every hiring decision aligns with workforce priorities.
- Compensation Cycle Management:
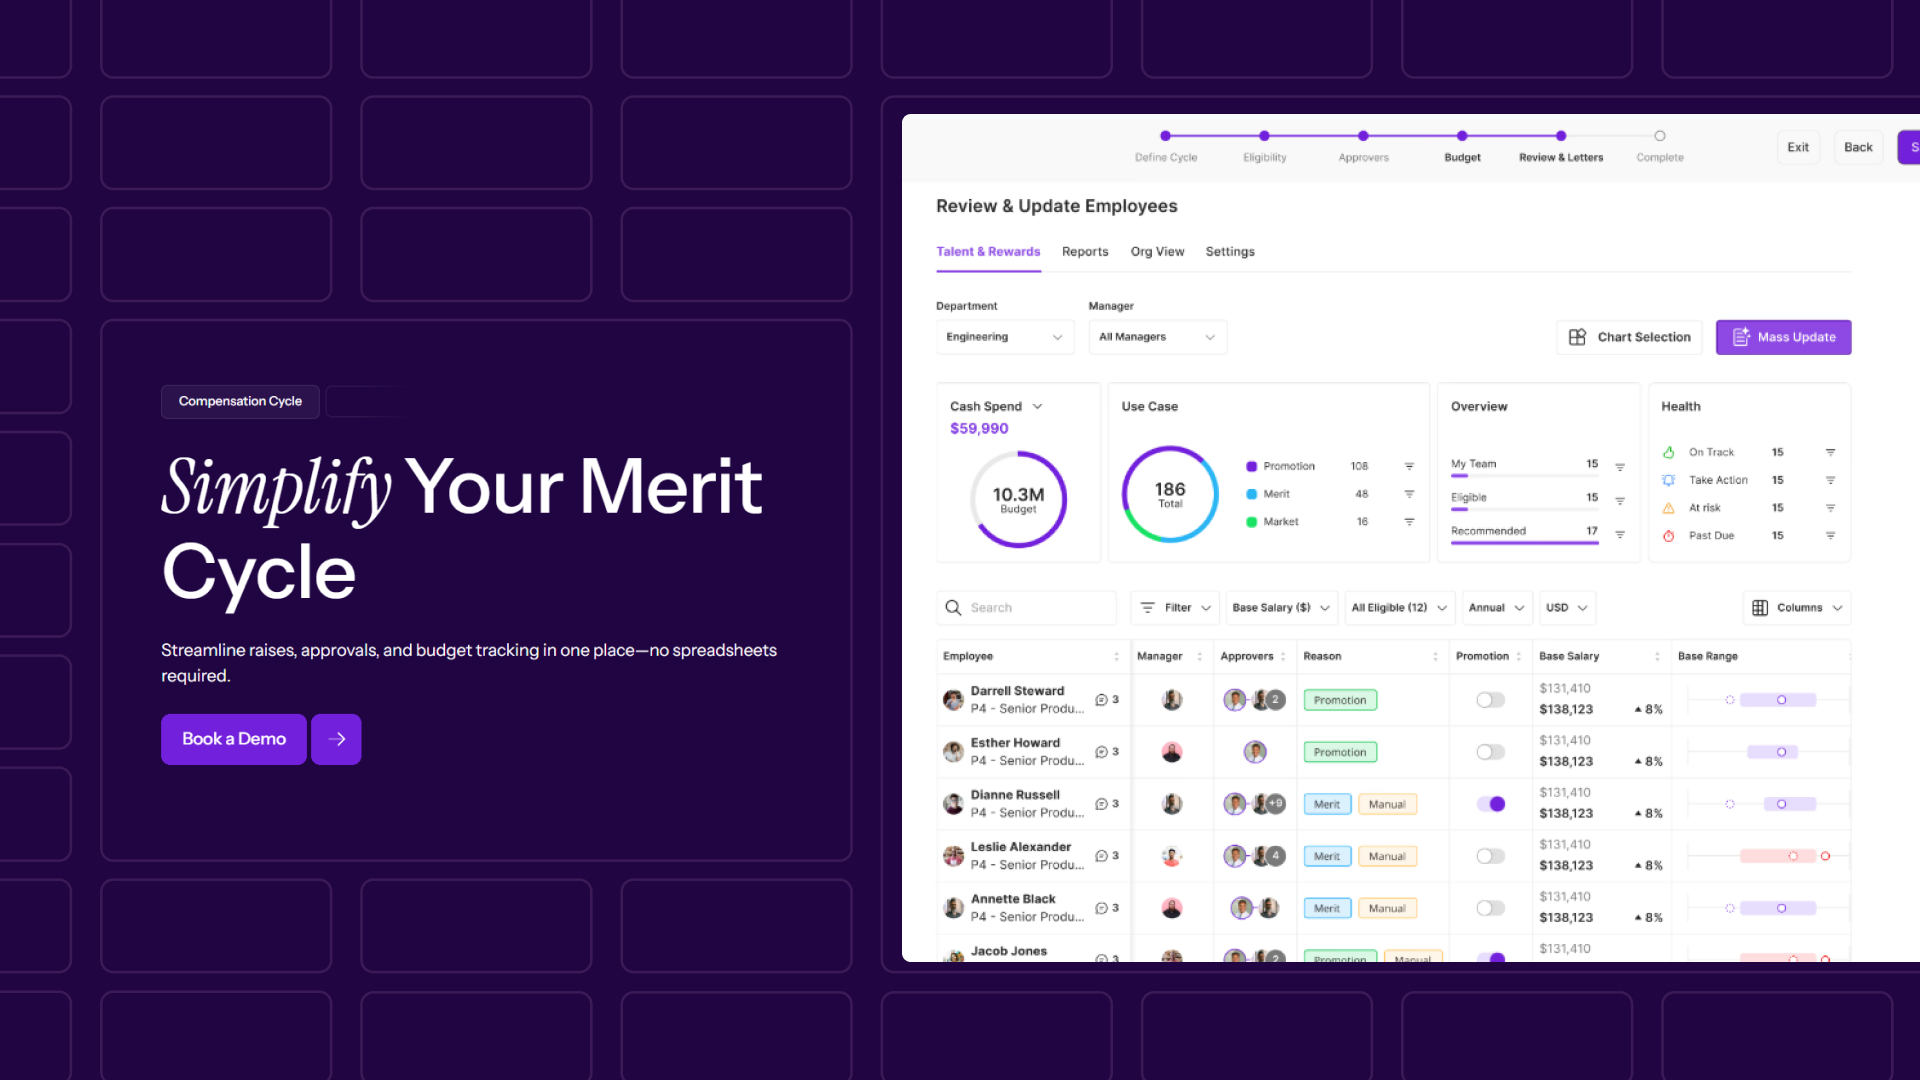
- Adjust merit increases and compensation decisions in one system using retention, performance, and market signals. This helps teams run cycles faster and maintain consistency across pay decisions.
- Compensation And Payband Builder:
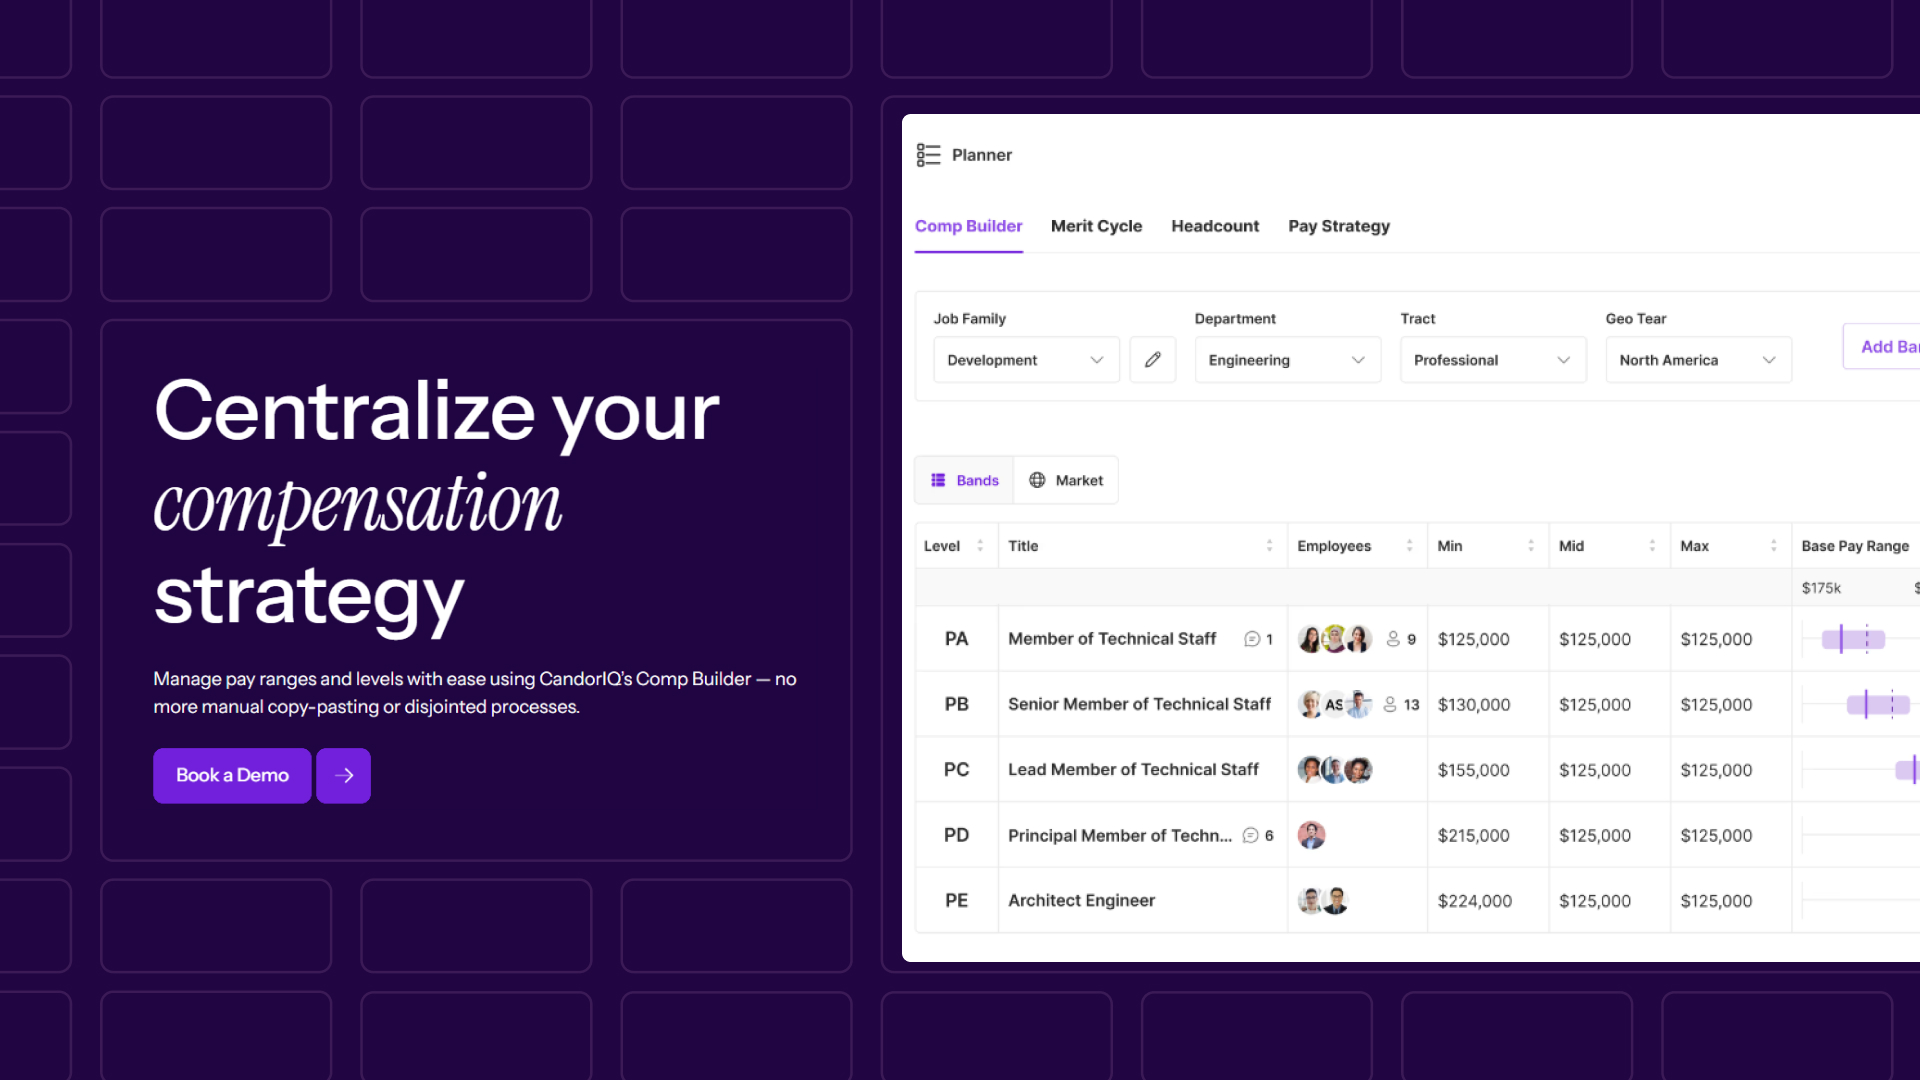
- Benchmark roles and map employees to pay bands using market data. This helps identify and fix pay gaps early, improving offer competitiveness and internal consistency.
- Workforce Analytics And Management:
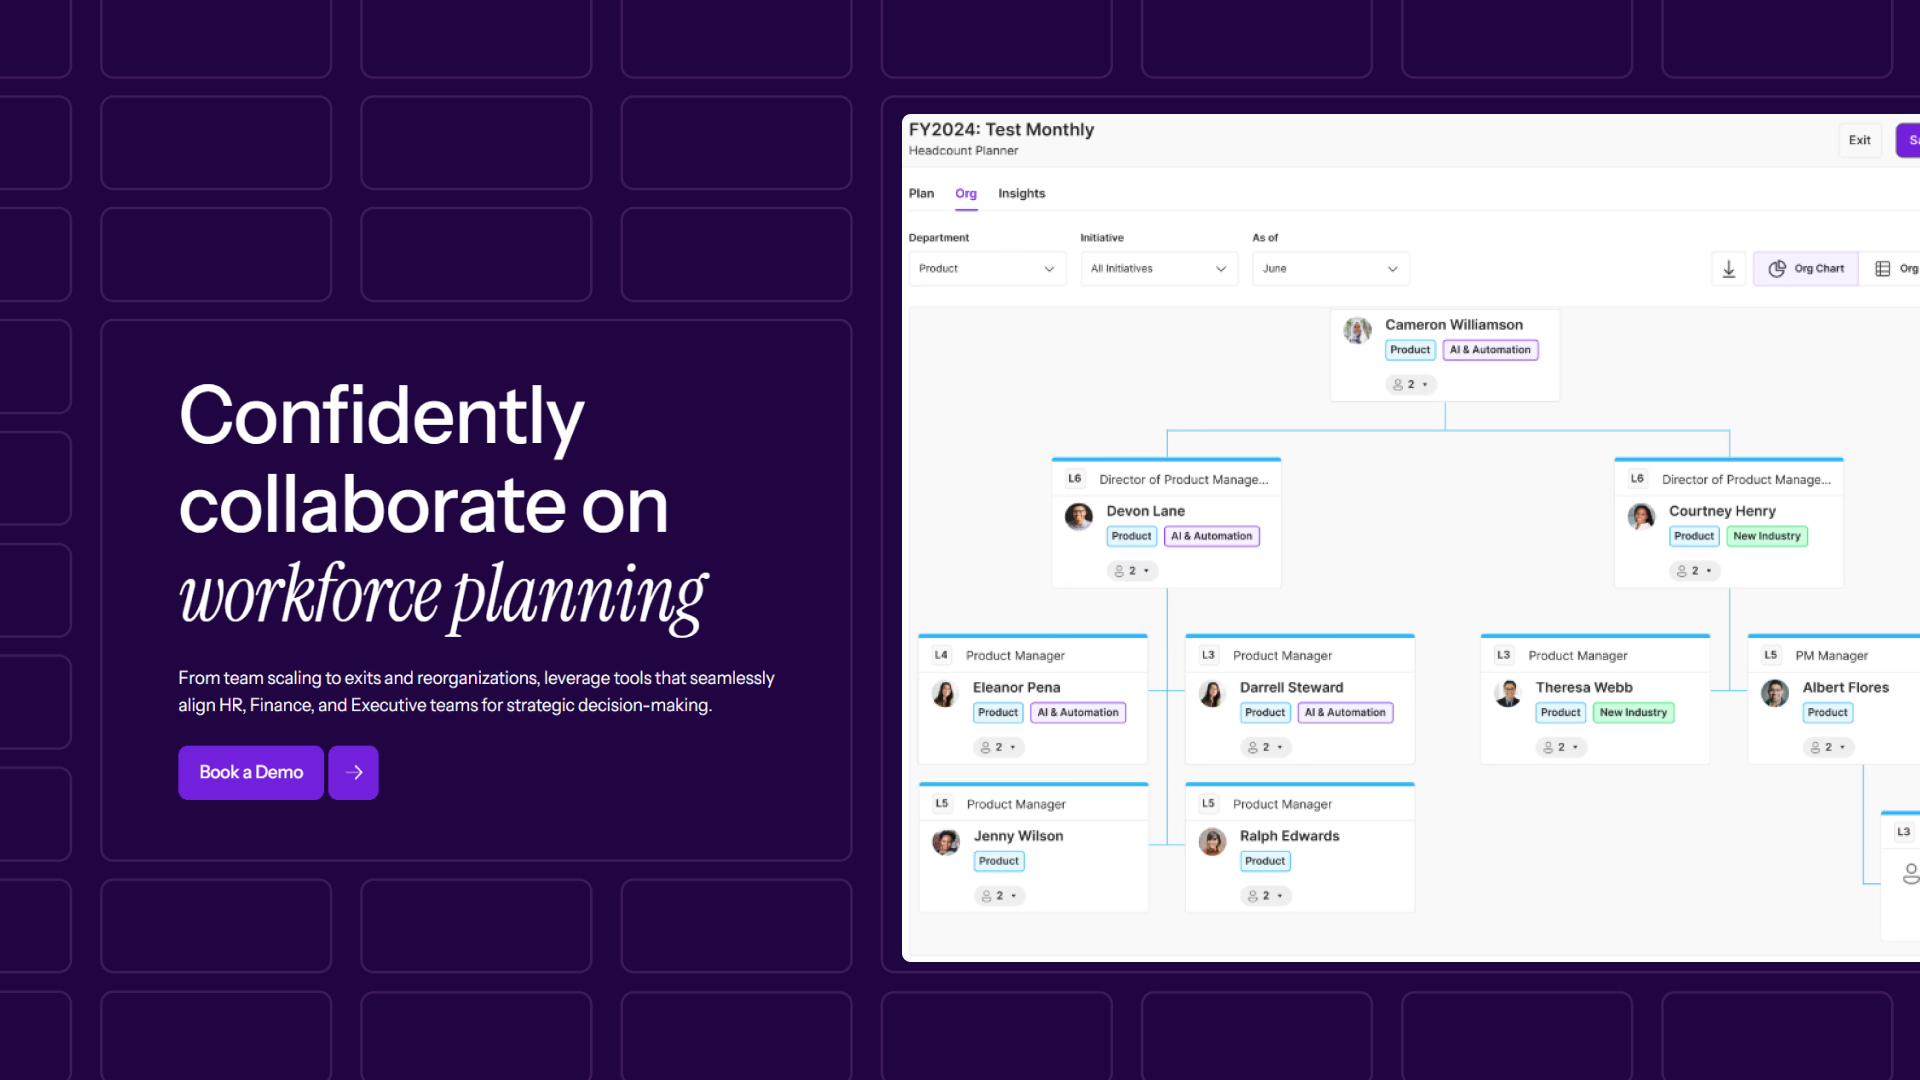
- Track headcount, workforce spend, and performance trends in one view. This helps teams turn KPI signals into ongoing planning adjustments instead of one-time decisions.
CandorIQ connects KPI tracking with execution, helping you act on workforce signals immediately and keep hiring, compensation, and budgets aligned as the organization scales.
.png)
FAQs
1. How do planning KPIs differ from reporting KPIs?
Reporting KPIs look back at what has already happened, while planning KPIs help teams make earlier decisions on hiring, pay, and workforce budgets before issues grow.
2. Which metrics are most useful for headcount planning?
Time to Fill, Revenue per Employee, and Voluntary Turnover Rate are especially useful because they show hiring demand, productivity, and possible workforce gaps.
3. Why do these metrics often fail to influence compensation decisions?
They are often tracked separately from pay data, which makes it harder to connect attrition, offer declines, or hiring friction to salary structures and market positioning.
4. How can these metrics help reduce hiring delays?
Reviewing Time to Fill alongside Offer Acceptance Rate helps teams see whether delays come from sourcing, approval bottlenecks, or weak pay positioning.
5. Which metrics help identify hidden workforce costs?
Cost Per Hire, Overtime Cost, and Revenue per Employee help reveal where labour spend is rising without a matching improvement in output.
Ready to modernize your workforce and compensation strategy?
See how CandorIQ brings workforce planning and compensation together with AI.