Best HR KPI Dashboards and Examples
Explore the best HR KPI dashboards like Executive, Employee Performance & Turnover. Boost decision-making. Visit now for top solutions!

If you're relying on scattered spreadsheets or delayed reports to manage workforce performance, you're missing critical insights. Today’s business leaders need instant visibility into headcount, compensation, attrition, and performance trends to stay ahead. That’s where the best HR KPI dashboard makes the difference. It turns fragmented data into actionable intelligence. We understand how frustrating and time-consuming it can be to juggle multiple disconnected data sources while trying to make timely, informed decisions about your workforce.
In this article, you’ll explore the key metrics every executive should track, real-world dashboard examples, and how to build a system that aligns HR strategy with business outcomes.
TL;DR:
- HR KPI dashboards provide real-time visibility into headcount, attrition, compensation, and performance for better strategic decisions.
- Dashboards help reduce risks, align workforce costs with growth, and enable fast, data-backed responses to change.
- Key metrics to track include headcount health, attrition trends, pay equity, hiring funnel efficiency, and promotion velocity.
- CandorIQ connects HRIS, payroll, and performance data to create live, role-based dashboards for execs, HR, and finance leaders.
- Forecasting, DEI insights, audit readiness, and budget modeling make CandorIQ dashboards a strategic control panel, not just a report.
What Is an HR KPI Dashboard?
An HR KPI dashboard is a centralized, real-time view of your organization’s most critical people metrics. Instead of chasing fragmented reports across systems, you get one clear lens into workforce performance, compensation, headcount health, and strategic progress, all in one place.
For business leaders like you, it’s not about more data. It’s about the right data presented in a way that enables faster, smarter decisions.
Why HR KPI Dashboards Matter to Business Strategy
You’re making daily decisions tied to workforce costs, performance, and planning. Without timely visibility into KPIs, such as attrition trends, headcount changes, or budget usage, you’re flying blind.
Core Elements of an HR KPI Dashboard
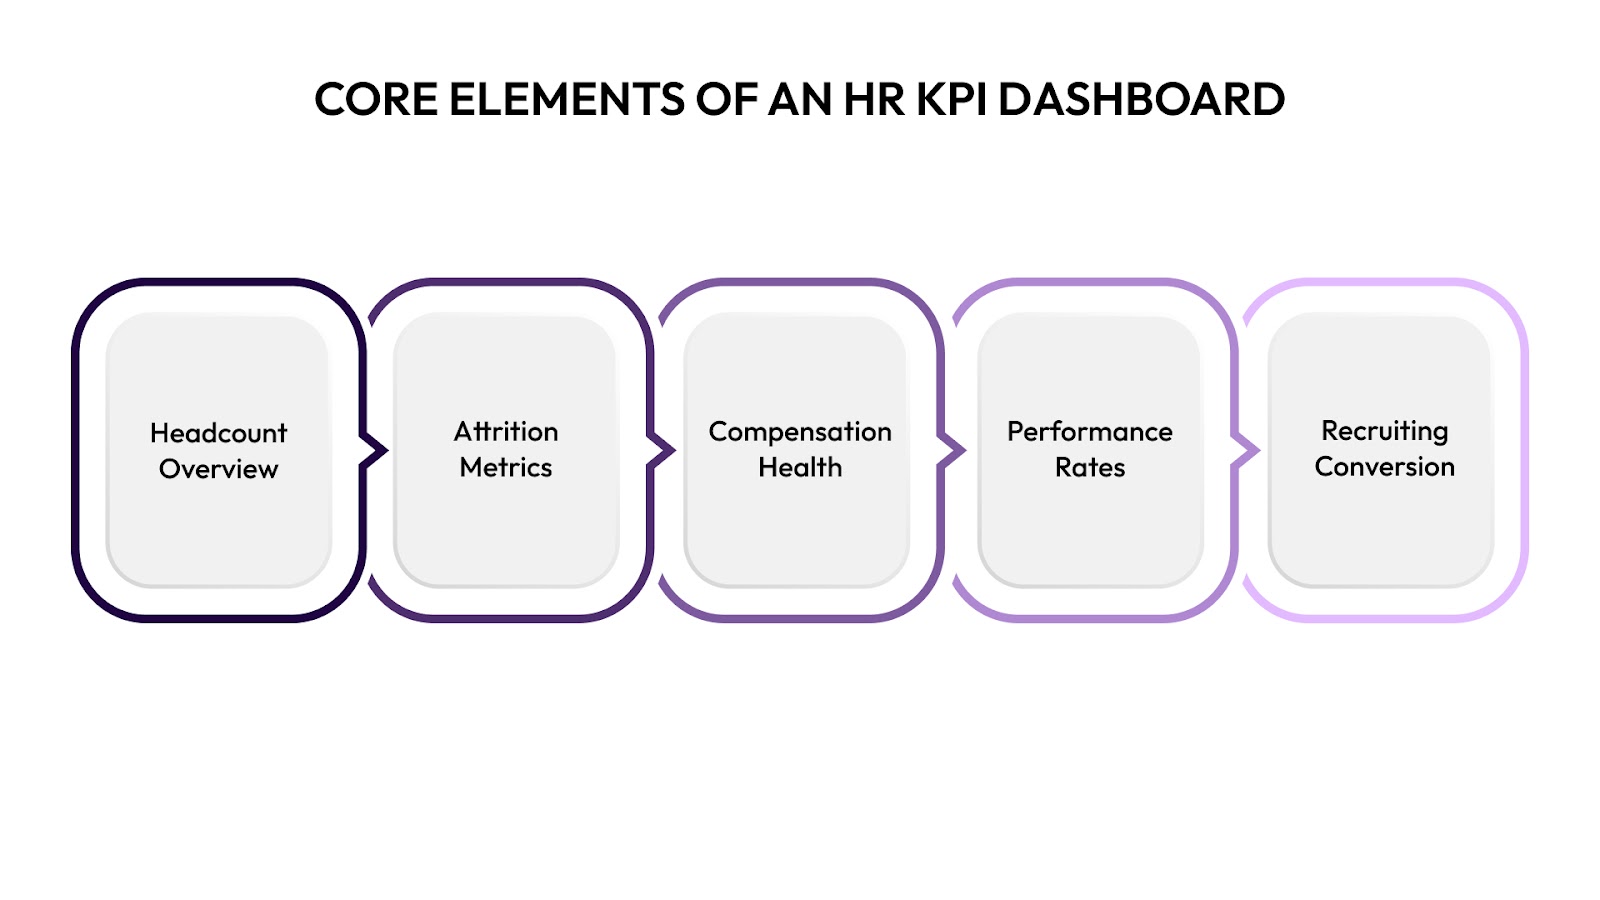
A high-performing HR KPI dashboard typically includes:
- Headcount Overview: Track planned vs. actuals, hiring velocity, open roles, and backfill status.
- Attrition & Retention Metrics: Monitor turnover by team, tenure, location, or manager to flag hotspots early.
- Compensation Health: View pay equity, budget allocation, and raise distribution by level or department.
- Performance & Promotion Rates: Compare top performer trends, promotion velocity, and internal mobility.
- Recruiting & Offer Conversion: Track time-to-fill, offer acceptance rates, and hiring funnel metrics.
These dashboards aren’t static. With tools like CandorIQ, they’re dynamic, interactive, and customizable based on the needs of CFOs, CHROs, People Ops, or team leads.
Strategic Advantages for Executives
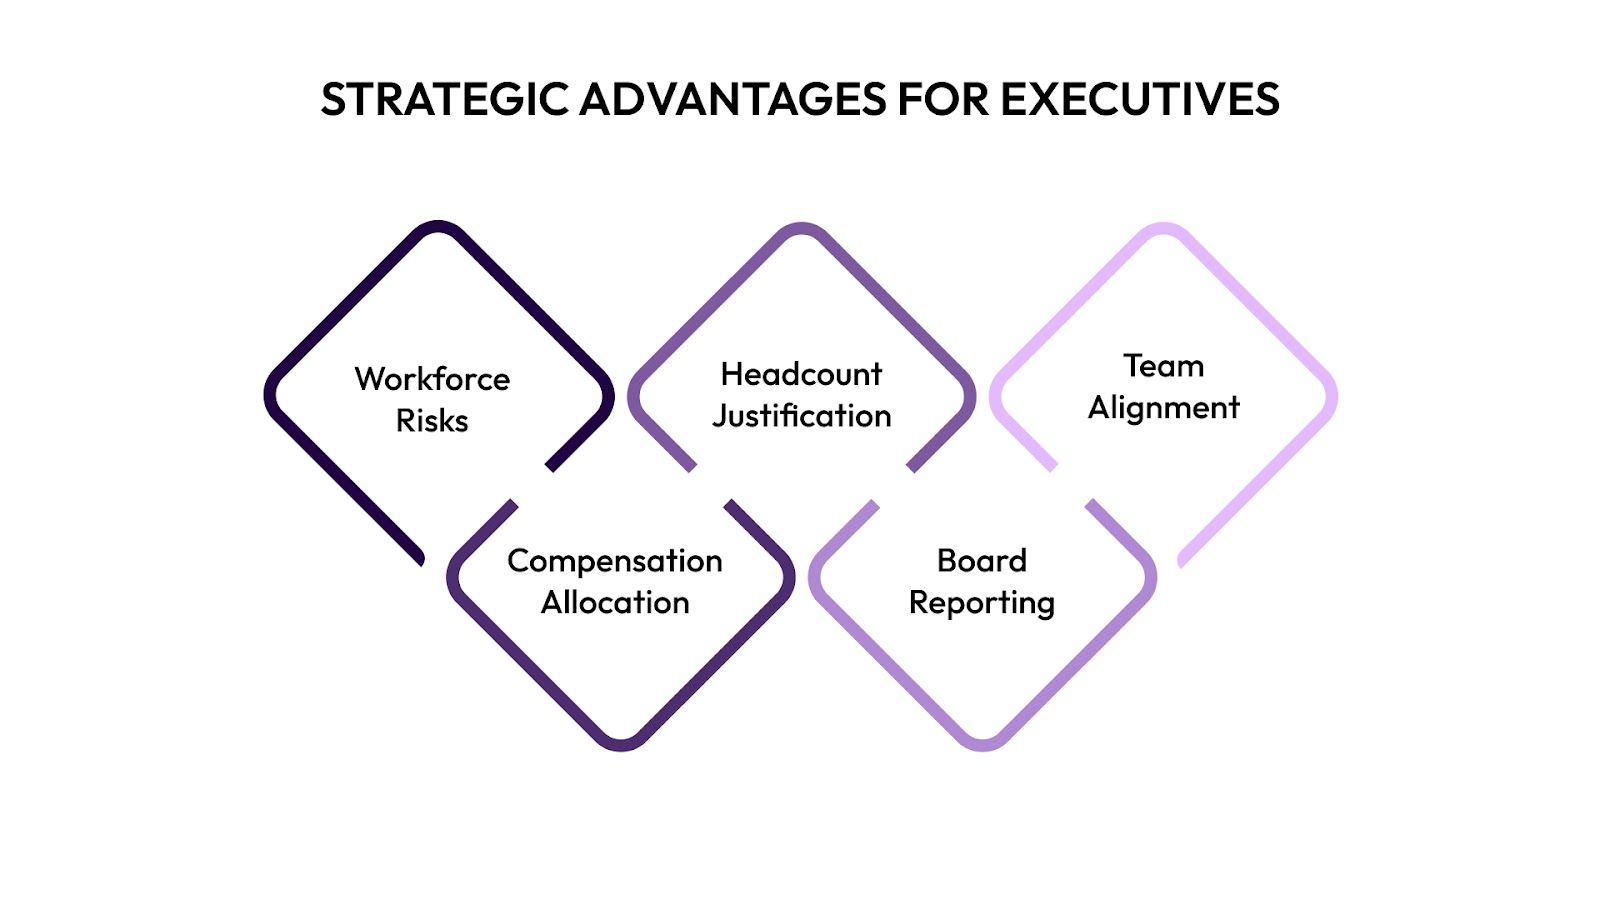
When your HR dashboards are aligned with business strategy, you can:
- Identify workforce risks before they impact delivery
- Allocate compensation fairly and efficiently
- Justify headcount requests with real-time data
- Report to boards with confidence and clarity
- Reduce misalignment between HR, Finance, and Ops.
The best HR KPI dashboard gives you more than visibility, it gives you control. And in fast-scaling environments, control is what separates reactive from strategic leadership.

Why Business Leaders Need HR KPI Dashboards
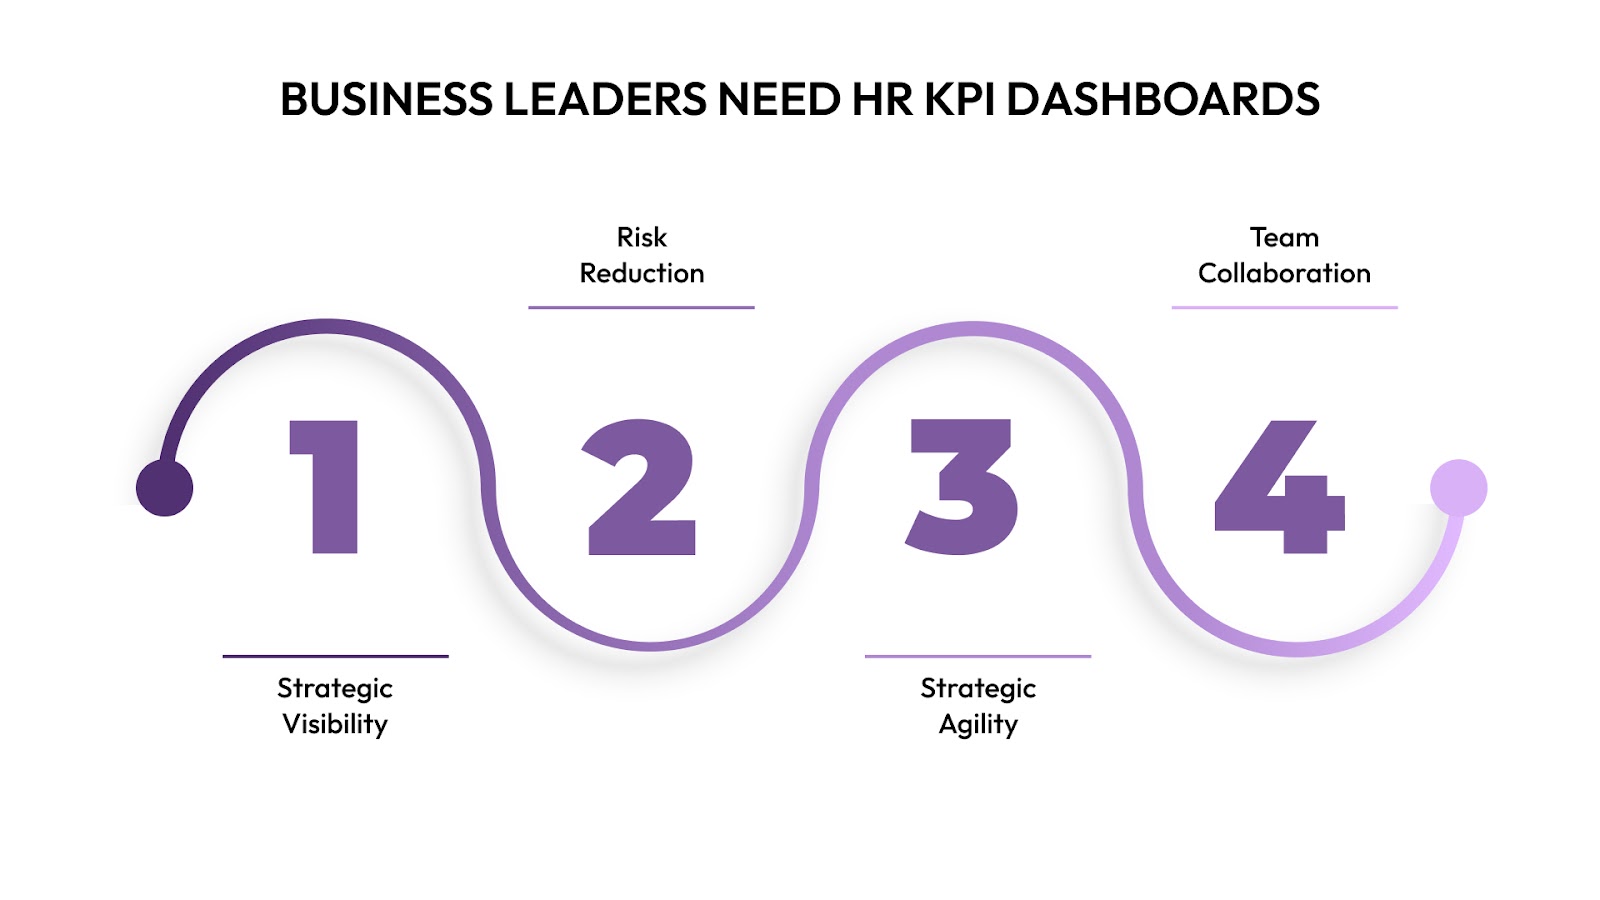
As a business executive, your people strategy directly impacts your bottom line. Yet, without a structured view of your workforce data, you’re left reacting to symptoms rather than proactively steering outcomes. That’s where the best HR KPI dashboard becomes essential as a strategic command center.
Visibility Where It Matters Most
You can’t optimize what you can’t see. An HR KPI dashboard gives you real-time clarity across:
- Headcount allocation and growth plans: Ensure every hire aligns with budget and business velocity.
- Attrition and retention health: Spot early warning signs by department, location, or tenure.
- Compensation accuracy and fairness: Monitor pay equity and track adherence to compensation bands.
- Recruitment funnel performance: See how offer acceptance rates and time-to-fill impact delivery.
Risk Reduction
Disjointed or outdated HR data puts your organization at risk:
- Compliance and pay transparency: A dashboard helps enforce consistent, auditable pay practices.
- Budget overrun: Align workforce plans with finance forecasts to avoid overspending.
- Talent flight: Identify which teams or roles are most vulnerable to attrition and why.
Strategic Agility
In fast-moving markets, your workforce needs can change overnight. The best HR KPI dashboard allows you to:
- Run what-if scenarios with real-time inputs
- Justify or delay hiring based on updated demand
- Pivot budgets and compensation plans as needed
- Provide data-backed updates to your board or investors
Empower Cross-Functional Collaboration
HR data shouldn’t live in a silo. Dashboards empower your People, Finance, and Ops leaders to:
- Work from the same source of truth
- Reduce time spent reconciling spreadsheets
- Coordinate actions based on shared workforce insights
As a business leader, your success depends on timely, accurate, and actionable workforce data. The best HR KPI dashboard isn’t optional, it’s your competitive edge.
Core Metrics You Should Be Tracking
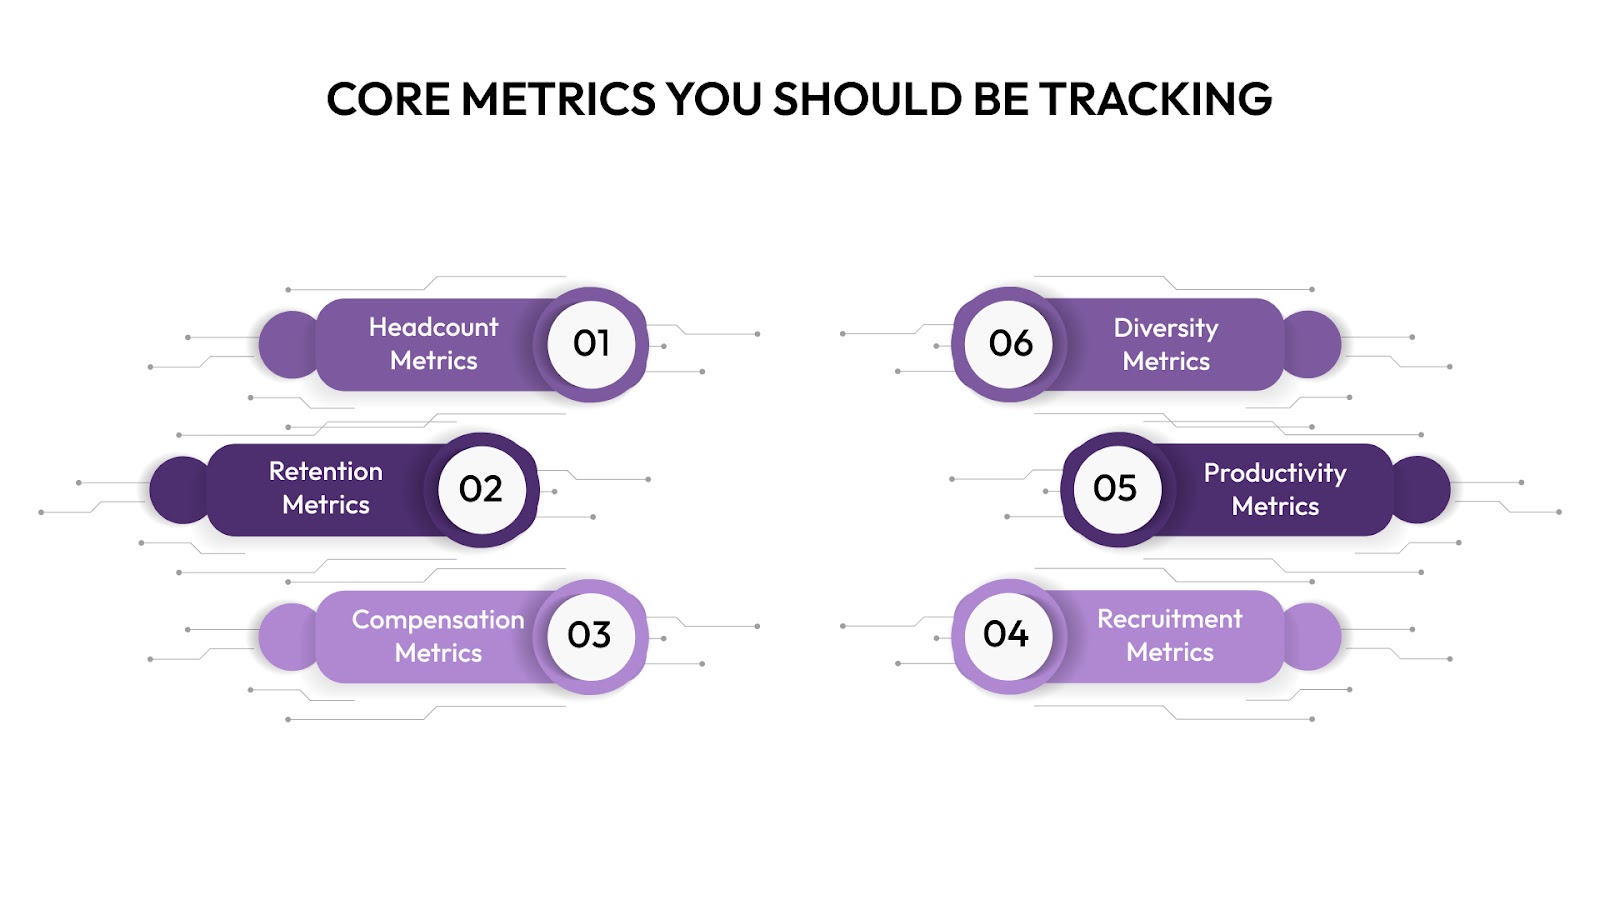
Building the best HR KPI dashboard starts with identifying the right metrics, not vanity data, but KPIs that offer real insight into workforce health, financial impact, and strategic alignment. As a business executive, you need to track what moves the needle across hiring, retention, performance, and planning.
Below are the core categories and metrics you should include:
1. Headcount Metrics
Understand how your team is structured, growing, and resourced.
- Total Headcount: Track growth vs. plan by department, function, or location.
- New Hires vs. Exits: Measure net gain/loss monthly or quarterly.
- Open Requisitions: Spot gaps in critical teams and monitor hiring bottlenecks.
- Span of Control: Analyze manager-to-direct report ratios to flag burnout or inefficiency.
2. Attrition and Retention Metrics
Stay ahead of talent risk by measuring where and why people leave.
- Voluntary vs. Involuntary Attrition: Separate culture-related exits from performance terminations.
- Turnover Rate by Role/Manager: Identify high-risk areas before they affect delivery.
- Retention Rate of Top Performers: Protect your high-value employees.
3. Compensation Metrics
Ensure pay equity, budgeting discipline, and smart headcount scaling.
- Compensation-to-Revenue Ratio: Calculate the proportion of total compensation costs relative to revenue to assess workforce investment efficiency.
- Pay Equity Gaps: Detects inconsistencies across gender, role, or geography.
- Budget Utilization by Team: Track compensation budget usage across departments in real-time.
With CandorIQ, you can model the impact of pay adjustments instantly, before they affect your bottom line.
4. Recruitment Funnel Metrics
Optimize your hiring engine and reduce time-to-productivity.
- Time-to-Fill: Measure how long it takes to hire for each role.
- Offer Acceptance Rate: Improve comp strategies and candidate experience.
- Cost-per-Hire: Identify inefficiencies across sourcing channels.
5. Performance & Productivity Metrics
Connect performance data to compensation and planning decisions.
- Performance Ratings Distribution: Monitor review score trends across teams or time periods.
- Promotion Rates: Track internal mobility and succession strength.
- Goal Completion Rate: Assess how teams are executing against OKRs or KPIs.
6. Diversity & Inclusion Metrics
Drive representation, fairness, and measurable DEI progress.
- Workforce Demographics: Track representation by level, function, or geography.
- Hiring Funnel Diversity: Understand conversion rates for underrepresented groups.
- Promotion Equity: Ensure advancement is based on performance, not bias.
Use CandorIQ to build dynamic dashboards tailored to executive, HRBP, or FP&A views, no manual reporting, no reconciliation delays.
Examples of the Best HR KPI Dashboards
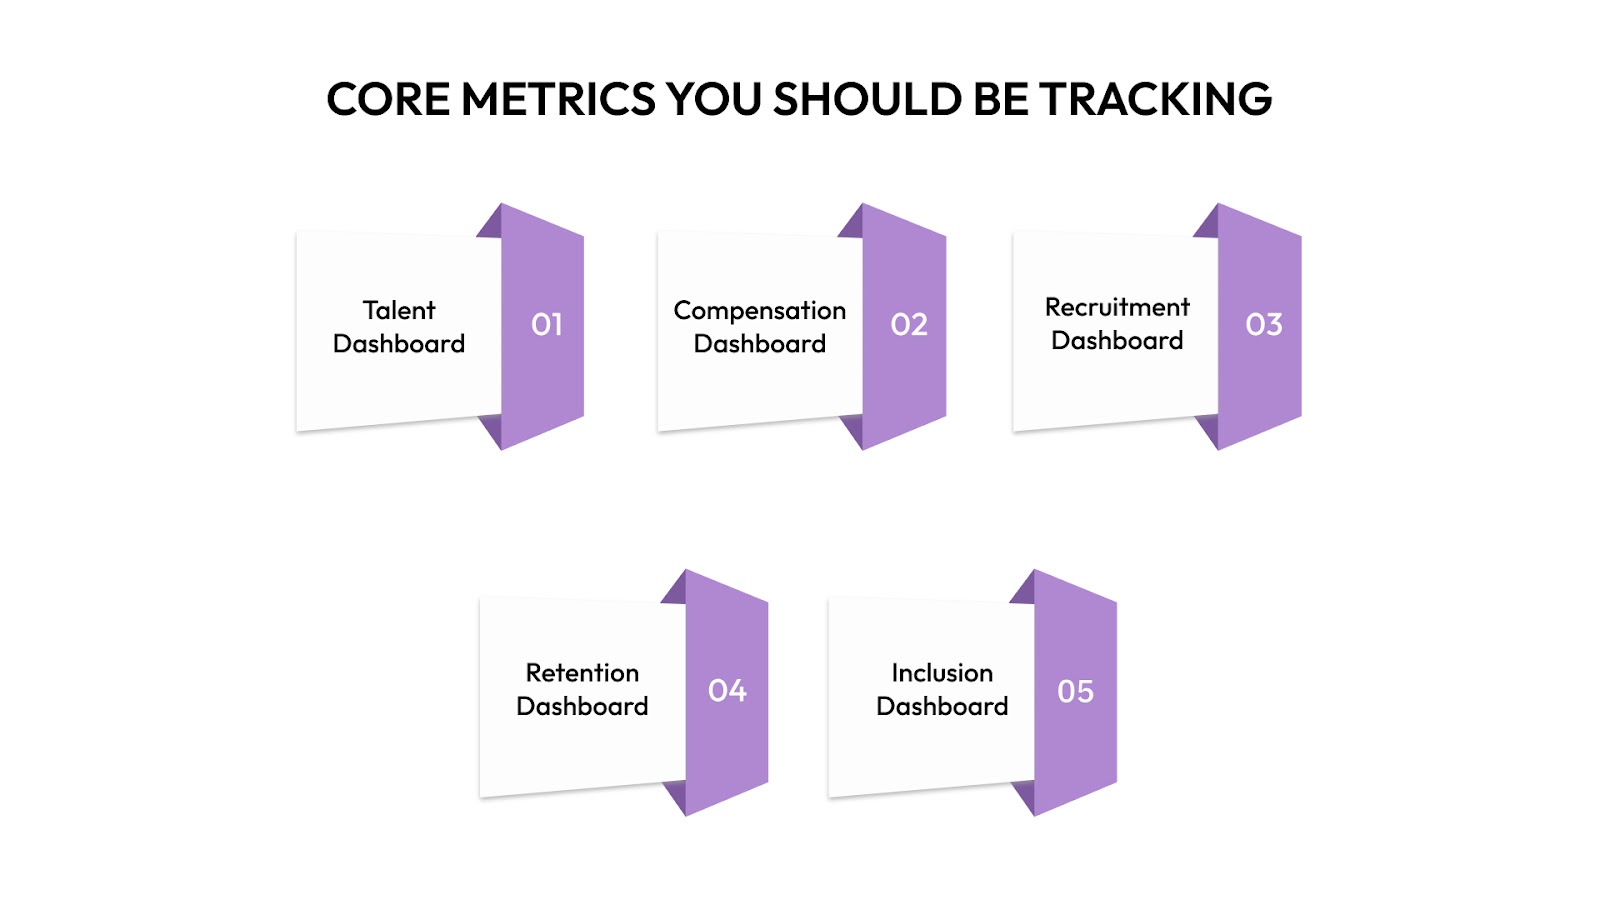
Not all dashboards are created equal. The best HR KPI dashboards deliver clarity, speed, and actionable insight tailored to business goals, not just static reports. Whether you're steering workforce strategy, managing risk, or aligning HR with finance, a well-designed dashboard should empower you to act, not just observe.
Below are high-impact dashboard examples business leaders trust for real-time decision-making:
1. Executive Workforce Health Dashboard
Monitor organizational performance at a glance, ideal for board meetings, quarterly planning, or investor updates.
Key Metrics:
- Total headcount vs. budgeted headcount.
- Voluntary/involuntary attrition rates by department.
- Compensation spend vs. revenue per FTE.
- Top talent retention and promotion rates.
- Diversity metrics across senior roles.
You get a single source of truth to track whether your workforce strategy is scaling in line with company growth and financial targets.
2. Compensation Governance Dashboard
Give Finance and HR leaders complete oversight into pay structure, equity, and budget discipline.
Key Metrics:
- Pay bands vs. actual salaries,
- Pay equity gaps by gender, level, or location,
- Budget utilization by team,
- Raises and bonuses by performance rating,
- Geo-adjusted comp variance.
With CandorIQ, you can visualize comp data, run simulations, and forecast cost impacts, all before approving changes.
3. Recruitment & Hiring Efficiency Dashboard
Help Talent and People Ops teams diagnose hiring pipeline effectiveness and improve conversion.
Key Metrics:
- Time-to-fill and time-to-start by role,
- Offer acceptance rate,
- Cost-per-hire across channels,
- Diversity pipeline ratios (e.g. sourced vs. hired),
- Hiring velocity by department.
You spot hiring friction fast before it slows down your business units. Great for scaling companies with aggressive headcount plans.
4. Attrition Risk & Retention Dashboard
Proactively manage turnover and safeguard institutional knowledge.
Key Metrics:
- Monthly and YTD attrition,
- Exit reasons by department or role,
- Retention of high performers,
- Internal mobility and promotion rates,
- Engagement/pulse survey correlations.
When integrated with your HRIS, ATS, and compensation tools, this dashboard allows you to flag flight risks early, then course-correct before it’s too late.
5. Diversity, Equity & Inclusion (DEI) Dashboard
Track DEI progress beyond hiring quotas—focus on representation, mobility, and pay fairness.
Key Metrics:
- Gender and ethnic diversity across job levels,
- Offer acceptance by demographic,
- Pay equity gaps by cohort,
- Promotion rates by demographic group,
- Inclusion metrics via surveys or feedback tools.
Moves DEI from a compliance checkbox to a measurable business outcome. Drives accountability across functions.
Each of these dashboards can be built and customized in CandorIQ, designed for HR, Finance, and Exec teams to collaborate on a single platform. No spreadsheets. No back-and-forth emails. Just data that informs your next move, fast.
How CandorIQ Elevates Your Dashboard Strategy
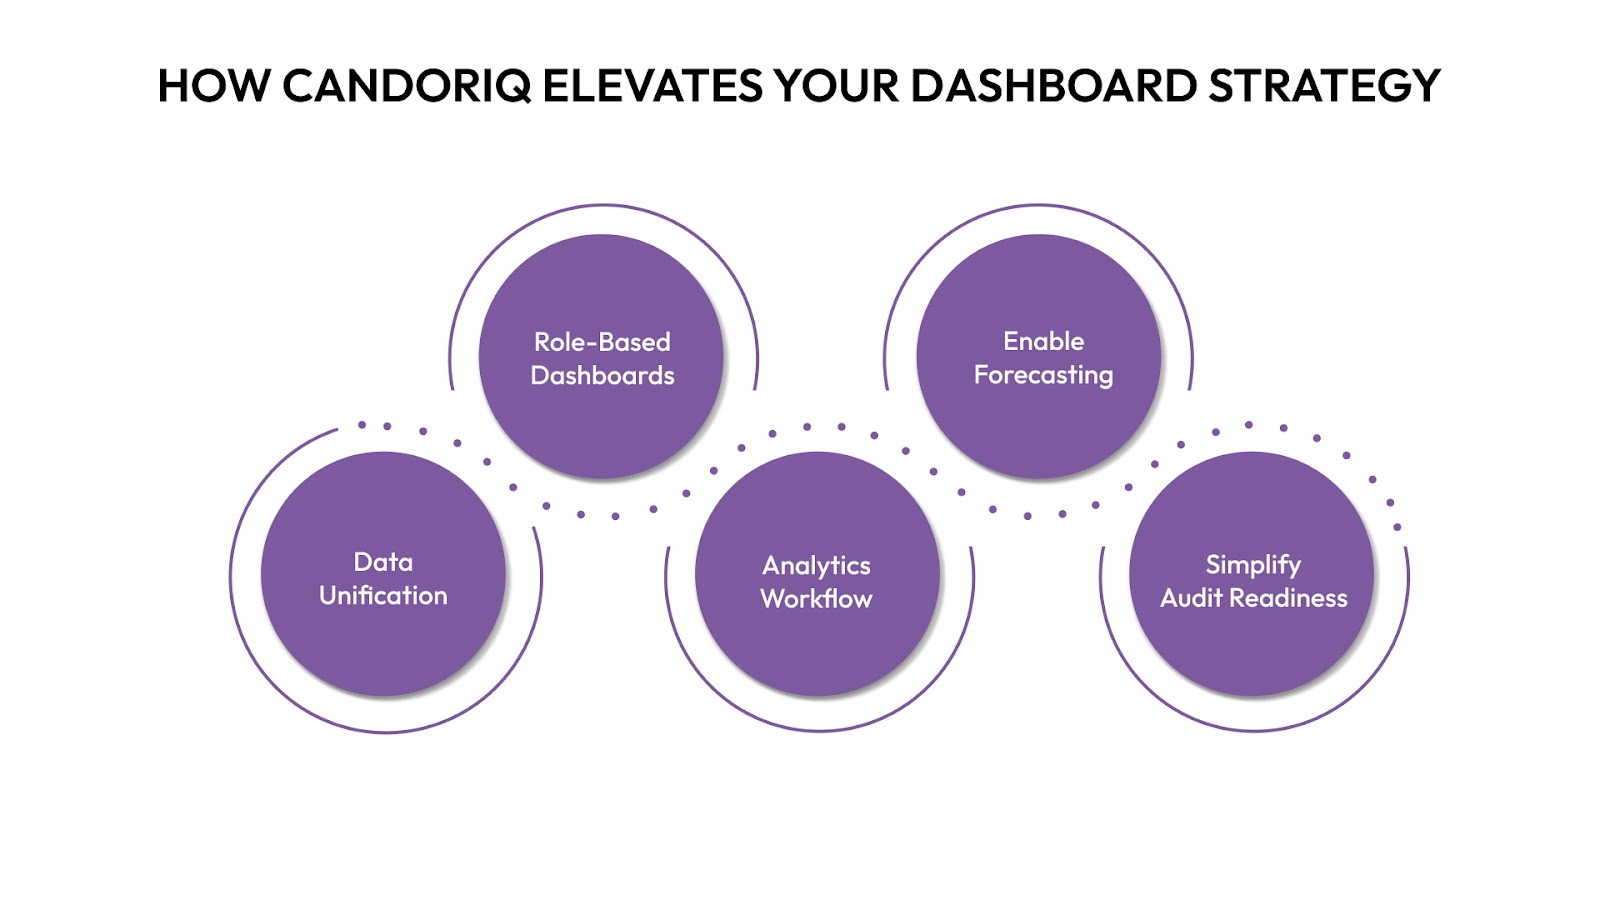
You don’t just need dashboards, you need decision-grade insights. CandorIQ doesn’t stop at visualizing metrics; it transforms the way your HR and Finance leaders operate. By centralizing compensation, headcount, and workforce health into a single, intelligent view, CandorIQ enables you to act faster, with greater confidence.
Here’s how CandorIQ takes your best HR KPI dashboard from useful to indispensable:
1. Unify Disconnected Data for a Single Source of Truth
Your data is only as good as your ability to use it. CandorIQ pulls live inputs from:
- HRIS, ATS, payroll, and finance tools
- Compensation systems and equity models
- Performance tracking and engagement platforms
This eliminates data silos and manual reconciliation, giving you:
- Real-time headcount vs. plan visibility
- Budget accuracy within ±2% variance
- Streamlined comp and workforce reporting in one view
2. Build Role-Based Dashboards for Execs, HR, and Finance
Universal reporting doesn’t work. CandorIQ lets you tailor dashboards based on stakeholder priorities:
- For CFOs: Budget utilization, burn rate, comp-to-revenue ratios
- For CHROs: Pay equity, promotion velocity, turnover by performance band
- For People Ops: Open roles, fill time, offer effectiveness
These targeted dashboards foster cross-functional alignment and eliminate miscommunication between departments.
3. Layer Analytics with Workflow Context
Unlike static BI tools, CandorIQ ties metrics directly to workflows:
- View budget impact before approving a headcount request
- See DEI metrics while building offer letters
- Model promotion costs during performance reviews
4. Enable Predictive Forecasting and Scenario Planning
Reactive dashboards are no longer enough. CandorIQ equips you with AI-enhanced forecasting:
- Model compensation changes against retention risk
- Simulate different hiring velocity scenarios
- Predict equity dilution over 12–24 months
This helps you move from insight to foresight, and make better-informed decisions on workforce investments.
5. Simplify Compliance and Audit Readiness
From pay transparency mandates to DEI reporting, you need compliance baked in—not bolted on.
CandorIQ allows you to:
- Track historical changes with version control
- Generate audit-ready exports on-demand
- Align reporting with global and regional standards
Compliance-ready dashboards save HR teams an average of 12–15 hours/month on manual reporting.
With CandorIQ, your best HR KPI dashboard becomes a real-time operating system for workforce decisions. It’s not about more data, it’s about smarter direction.
Best Practices for Building High-Impact Dashboards
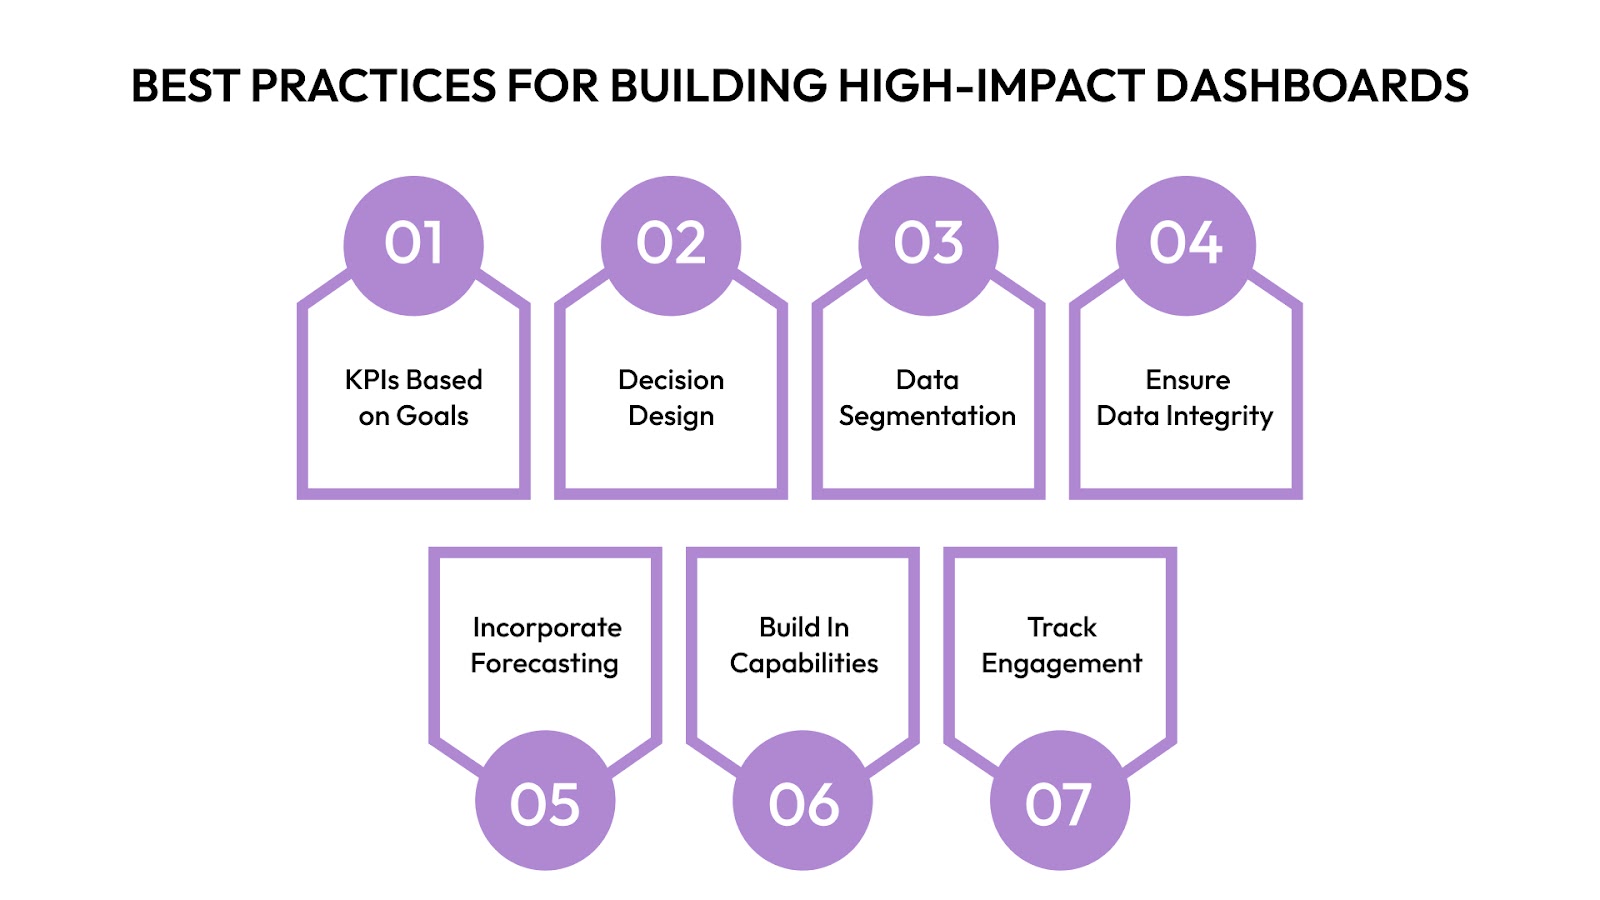
Build your HR KPI dashboard with precision, purpose, and stakeholder clarity. Here’s how to do it right:
1. Define KPIs Based on Business Goals: Don’t track metrics for the sake of it. Align each KPI with specific objectives, like reducing attrition, improving comp equity, or speeding up hiring cycles.
Example: Link time-to-fill with revenue loss per vacant role.
2. Design for Decision-Making, Not Just Reporting: Avoid clutter. Highlight trends, variances, and thresholds that prompt action.
- Use color-coded indicators for thresholds
- Prioritize metrics with financial or compliance implications
- Avoid vanity metrics unless they inform change
3. Segment Data by Audience: A CFO doesn’t need the same view as an HRBP. Customize dashboards based on role-specific needs:
- Execs: High-level trend lines, risks, ROI
- People Ops: Operational metrics, approval bottlenecks
- Finance: Burn rate, headcount vs. budget
4. Ensure Data Integrity and Real-Time Sync: Outdated or inaccurate dashboards erode trust. Connect your dashboard to verified sources, HRIS, payroll, comp platforms, and refresh data frequently.
5. Incorporate Forecasting Where It Matters: Overlay predictive indicators on dashboards for forward-looking insight.
- Attrition probability
- Headcount planning vs. ramp needs
- Compensation drift by department
6. Build In Drill-Down Capabilities: Enable deeper analysis without switching systems. Let users click into:
- Individual roles or teams
- Budget history
- Promotion timelines or offer conversion rates
7. Track Usage and Engagement: Monitor who’s using which dashboards and how often. Iterate based on feedback. High-performing teams revisit strategic dashboards 2x more often during planning cycles.
With these practices, your dashboard becomes more than a report, it becomes the engine room for smarter workforce strategy.

Conclusion
In a landscape where workforce agility defines competitive edge, the best HR KPI dashboard is your strategic control panel. When you track the right metrics, tailored to the right audiences, and powered by clean, real-time data, you unlock better decisions, faster planning, and stronger alignment across HR and Finance.
But building that kind of system takes more than spreadsheets or static reports.
CandorIQ equips you with dynamic dashboards designed for decision-makers—bringing together compensation, headcount, attrition, and budget metrics in one unified view. Whether you're scaling fast or tightening costs, our platform helps you move from reactive reporting to proactive strategy.
Ready to elevate your workforce visibility? Book a demo with CandorIQ and transform your HR data into bottom-line results.
Ready to modernize your workforce and compensation strategy?
See how CandorIQ brings workforce planning and compensation together with AI.