Workforce KPI Tracking: 10 KPIs People Ops Should Track in 2026
Fix your workforce KPI tracking in 2026. Track the 10 metrics that actually impact hiring, retention, and compensation decisions.

Finance sends over the approved headcount plan. You pull actuals from the HRIS. The numbers don't match. The board meeting is in three days.
Nobody made a mistake. The data just lives in three different places, updated on different schedules, by people who aren't working from the same system. And by the time you reconcile your version with Finance's, the situation on the ground has already changed.
That is the core problem workforce KPI tracking is meant to solve: the visibility gap that leaves you presenting headcount and compensation data that does not match what Finance is already looking at.
This guide covers what workforce KPIs are, why they matter for People Ops specifically, how to choose the right ones, and the 10 metrics most likely to close that visibility gap at a 100 to 500-person growth-stage company.
Key Takeaways
- Workforce KPI tracking works best when you focus on a small set of metrics that directly influence headcount, compensation, and hiring decisions.
- The most valuable KPIs connect workforce data to cost, retention, and hiring outcomes rather than tracking activity alone.
- Leading indicators such as pay compression and offer acceptance rate help you identify risks early, while lagging metrics confirm performance over time.
- Segmenting KPIs by department, tenure, and role provides clearer insights than relying on company-wide averages.
- Accurate KPI tracking depends on consistent data across systems, as fragmented data reduces visibility and delays planning decisions.
What Are Workforce KPIs?
Workforce KPIs (Key Performance Indicators) are measurable metrics used to track the health, cost, and performance of an organization's people. They are a subset of HR metrics, but not every metric qualifies as a KPI.
The distinction matters. An HR metric is any data point about the workforce, such as headcount, tenure, absence hours, and training completion. A KPI is a metric tied directly to a business decision or strategic goal. It has a target, an owner, and a clear consequence when it moves outside an acceptable range.
.png)
HR Metrics vs. Workforce KPIs: The Practical Difference
Suggested Read: Workforce Optimization Strategies to Maximize Productivity
Why Workforce KPI Tracking Matters for People Ops?
For a People Ops team managing a 200-person company with a team of three, the temptation is to track everything and report it upward. In practice, that approach tends to produce dashboards nobody trusts, metrics that are six weeks old by the time they get presented, and a constant sense that the data is not quite right.
People Ops and HR practitioners who narrow their focus to five to seven workforce planning KPIs are measurably better positioned to track progress than those managing longer lists. The reason is straightforward: fewer metrics mean clearer ownership, more reliable data, and faster action when something moves.
There are three specific things good workforce KPI tracking does for a People Ops lead:
- Closes the data gap with Finance. When you are tracking headcount and compensation from the same source Finance uses, the reconciliation conversation before every planning meeting stops. You walk in with numbers that match.
- Surfaces problems early. A declining offer acceptance rate or a rising pay compression ratio signals a problem weeks or months before it shows up in voluntary turnover. Leading indicators give you a window to act before the cost lands.
- Makes the business case for headcount. A CFO who sees compensation spend as a percentage of revenue alongside a headcount request has the context to approve it. A CFO who gets a headcount request without that context asks for more information first.
Leading vs. Lagging Workforce KPIs: Why You Need Both
Most standard KPI lists are dominated by lagging indicators: metrics that tell you what already happened. Voluntary turnover rate tells you who left last quarter. Cost per hire tells you what you spent last cycle. These are essential for understanding patterns, but they don't protect you from the next quarter's problem.
Leading indicators predict future outcomes by measuring conditions that drive results. They give you a window to act before a problem shows up in the data.
Leading vs. Lagging Workforce KPIs at a Glance
For a lean People Ops team, the practical goal is a mix: two to three leading indicators that flag risk early, and four to five lagging indicators that confirm whether your workforce strategy is actually working.
Suggested Read: Workforce Analytics: Examples, Benefits, and Best Practices
10 Workforce KPIs Worth Tracking at a Growth-Stage Company
These 10 KPIs are organized into three categories: headcount and cost visibility, compensation and retention signals, and recruiting efficiency. Together, they give you a shared picture of workforce health you can present to Finance, without needing a 30-metric dashboard that nobody updates.
A quick filter before you build your set: If a metric doesn’t change a decision, depends on manual updates, or rarely shows up in planning conversations, it won’t hold up as a KPI. It becomes reporting noise instead of a useful signal. The goal is not to track more, but to track what you can actually use.
Headcount and Cost Visibility
These three KPIs form the financial foundation of workforce reporting. They are the numbers Finance reaches for first in a planning conversation, and the ones People Ops most often presents in a format that doesn't match what Finance is already tracking.
1. Headcount vs. Plan
Compares actual filled seats against the approved headcount plan, broken down by department, location, and employment type. Overhiring burns the budget faster than planned; underhiring delays the output those roles were meant to produce.
Formula: (Actual Headcount / Planned Headcount) x 100
Target: 90 to 100% fill rate against plan, reviewed monthly alongside the FP&A cycle.
How to track it
- Track by department and employment type, not just as a single company number. A gap in Engineering reads differently from a gap in Sales.
- Reconcile with Finance monthly. Version control is the most common failure point here. You log actuals in the HRIS; Finance updates the plan separately. If both are not reconciled on the same cycle, the numbers will not match when it matters.
- Flag variances of more than 10% in either direction as a prompt for a conversation with Finance, not just a note in a report.
2. Compensation Spend as a Percentage of Revenue
Tracks the total people cost against the revenue the business is generating. For private SaaS companies, SaaS Capital's 2025 benchmarking survey of over 1,000 companies puts median revenue per employee at $129,724. That is a useful reference point when assessing whether your compensation spend is proportionate to your growth stage.
Formula: (Total Compensation Spend / Total Revenue) x 100
How to track it
- Run this before every merit cycle, not after. Knowing where total comp spend sits relative to revenue before you open the review round means you set budgets from a real baseline.
- Track the trend quarter over quarter, not just the current number. A ratio creeping up each quarter signals that compensation growth is outpacing revenue growth, which Finance will flag before you do.
- Use it alongside headcount vs. plan to show Finance the combined cost picture of your current workforce and any new roles being requested.
3. Total Cost of Workforce (TCOW)
TCOW captures the full cost of employing your people beyond base salary. SHRM defines it as the sum of direct compensation, benefits, payroll taxes, insurance, facilities, IT overhead, and contingent workforce costs. It gives you a complete picture of what each headcount decision actually costs the business, which is the number Finance needs to see before approving a new role.
Formula: Direct Compensation + Benefits + Labor Overhead (payroll taxes, insurance) + Workforce Overhead (IT, facilities, contingent workers)
How to track it
- Calculate TCOW per new hire before a role is approved, not after it is filled. The standard multiplier is 1.25 to 1.4 times base salary, including all overhead.
- Update the calculation annually or when your benefits package, office footprint, or contractor mix changes meaningfully, since those shifts affect the overhead component.
- Use it when presenting headcount requests to Finance. Showing the fully-loaded cost of a role, not just the salary, makes the business case more credible and reduces back-and-forth on approvals.
If your headcount and compensation numbers live in separate systems, CandorIQ gives you a view of that data that your Finance partner can work from directly, without a separate reconciliation step. Contact us to see how it works for your team.
Compensation and Retention Signals
These four KPIs connect compensation structure to retention outcomes.
4. Voluntary Turnover Rate (Segmented)
Most People Ops teams track overall turnover. The useful version breaks it down by department, tenure band, manager, and location. A 12% company-wide rate can hide a 28% rate in one department and a 6% rate everywhere else. Those two situations call for completely different responses.
Formula: (Number of Voluntary Departures in Period / Average Headcount in Period) x 100
How to track it
- Always segment by department, tenure band, and manager. A company-wide rate is a starting point. The signal lives in the breakdown.
- Review quarterly at a minimum. When a department or manager consistently shows elevated voluntary turnover, the cause is usually compensation competitiveness, career growth, or management quality. Each has a different fix.
- Set a threshold and a trigger. For example, a department rate above 15% prompts a review; above 20% triggers an immediate conversation with that manager and leadership.
5. Pay Compression Ratio
One of the most overlooked leading indicators for retention risk. Pay compression occurs when new-hire salaries in a role or level approach or exceed what longer-tenured employees in the same band earn. It builds quietly during rapid hiring phases and tends to surface when experienced employees compare notes or get counter-offers.
Formula: (Average New Hire Salary for Role / Average Salary of Employees in Same Role with 2+ Years Tenure). A ratio approaching 0.90 or above warrants a compensation review.
How to track it
- Run this check after every significant hiring phase, particularly if your company has added 20% or more to headcount in 12 months without a band review during that window.
- Compare at the role and level, not across the whole company. Compression in an Engineering IC3 role is invisible at the company level but expensive at the team level.
- Flag it as a leading indicator, not a lagging one. By the time voluntary turnover among tenured employees rises, the compression has usually been building for six to twelve months already.
6. Offer Acceptance Rate
A declining offer acceptance rate is one of the earliest signals that your pay structure has fallen behind the current market. It often shows up before your benchmarking data catches the gap, because the market is already telling you through candidate behavior.
Formula: (Number of Offers Accepted / Total Offers Extended) x 100
Reference point: Many recruiting teams track 85% or above as a working benchmark, though this varies by function, seniority, and geography.
How to track it
- Break this down by role and department, not just as a company-wide figure. A blended rate of 82% can mask a 65% acceptance rate in one function where the pay band has not been updated in 18 months.
- Track the trend over rolling periods. A rate dropping from 88% to 79% over two quarters is a clearer signal than a single low reading.
- Connect declines directly to pay band reviews. When a function's acceptance rate falls below your threshold, treat it as a prompt to check whether that role's range is still competitive, before your next benchmarking cycle does it for you.
7. Internal Mobility Rate
Measures the share of open roles filled by existing employees through promotion or lateral transfer. It matters for two practical reasons. External hires cost more and take longer to reach full productivity than internal moves. And employees who see a clear career path within the company tend to stay longer than those who need to leave to advance.
Formula: (Internal Fills / Total Fills in Period) x 100
How to track it
- Track alongside voluntary turnover by tenure. Low mobility, with high mid-tenure exits, often signals a pay-band issue in which internal growth doesn’t meet market expectations.
- Set targets based on growth stage. Faster-growing companies naturally see lower mobility, so interpret the metric in context.
- Review quarterly and share with leadership. Visibility helps managers identify internal candidates before roles go external.
8. Regrettable Turnover Rate
Not all turnover is equal. Regrettable turnover tracks employee departures that the company wanted to keep: typically high performers, key skill holders, and employees in critical roles. Tracking this separately from overall voluntary turnover gives you and leadership a cleaner signal of actual retention risk versus natural attrition.
Formula: (Number of Regrettable Departures / Total Voluntary Departures) x 100
How to track it
- Define who counts as regrettable before you start tracking. This needs to be agreed with managers and leadership upfront, usually based on performance rating, role criticality, or skill scarcity. Consistent classification is what makes the metric meaningful over time.
- Review after every exit, not just at quarter end. Classifying a departure as regrettable or not immediately after it happens gives you cleaner data than trying to reconstruct it months later.
- Use it to test whether compensation and career programs are working. If regrettable turnover remains high despite retention initiatives, the problem is likely compensation competitiveness or career-path visibility, and the data gives you the case to act on it.
Recruiting Efficiency
These two KPIs directly link recruiting activity to financial outcomes. They are the metrics Finance will ask about when reviewing a headcount plan, because they determine how much approved headcount growth actually costs.
9. Time to Fill by Function
Time to fill is a recruiting metric that quickly becomes a financial one.
Formula: (Total Days from Role Approval to Offer Accepted) / Number of Roles Filled
How to track it
- Always track by function, not as a company average. Technical roles above 90 days often signal a compensation competitiveness issue. Sales roles with long fill times often point to unclear leveling or slow approval workflows. The function-level view tells you which problem you are solving.
- Start the clock at role approval, not job posting. Time spent in the internal approval process is invisible if you only measure from posting to offer. That lost time still costs you output.
- Cross-reference with the offer acceptance rate. When both the time to fill and the offer acceptance rate are moving in the wrong direction within the same function, the cause is almost always compensation.
10. Cost per Hire
Most teams calculate cost per hire too narrowly. They capture recruiter fees and job board costs but miss internal recruiter time, hiring manager interview hours, assessment tools, signing bonuses, and relocation. That narrower calculation understates the true cost by a meaningful margin.
A complete cost per hire includes:
- External recruiter or agency fees (where applicable)
- Internal recruiter time and operational overhead
- Job advertising and sourcing tool costs
- Interview time across all participants in the hiring process
- Signing bonuses, relocation assistance, and onboarding costs
Formula: (Total Internal + External Recruiting Costs) / Number of Hires in Period
At scale, the difference matters. If your plan calls for 80 hires and the actual cost per hire is $12,000 instead of the $7,000 estimated, that is $400,000 in unplanned budget before the first salary check is issued.
If your KPI tracking still depends on manual reconciliation across HR and Finance systems, it becomes difficult to act on the data quickly. Contact us to see how CandorIQ helps centralize this.
Suggested Read: AI-Driven Workforce Optimization: Enhancing Management and Productivity
How to Set Targets for Each Workforce KPI?
Picking KPIs is the first step. Setting targets is where most teams stop short. Without a target, a KPI is just a number that gets reported. It does not drive a decision.
Here is a practical approach to setting targets for each KPI in your set:
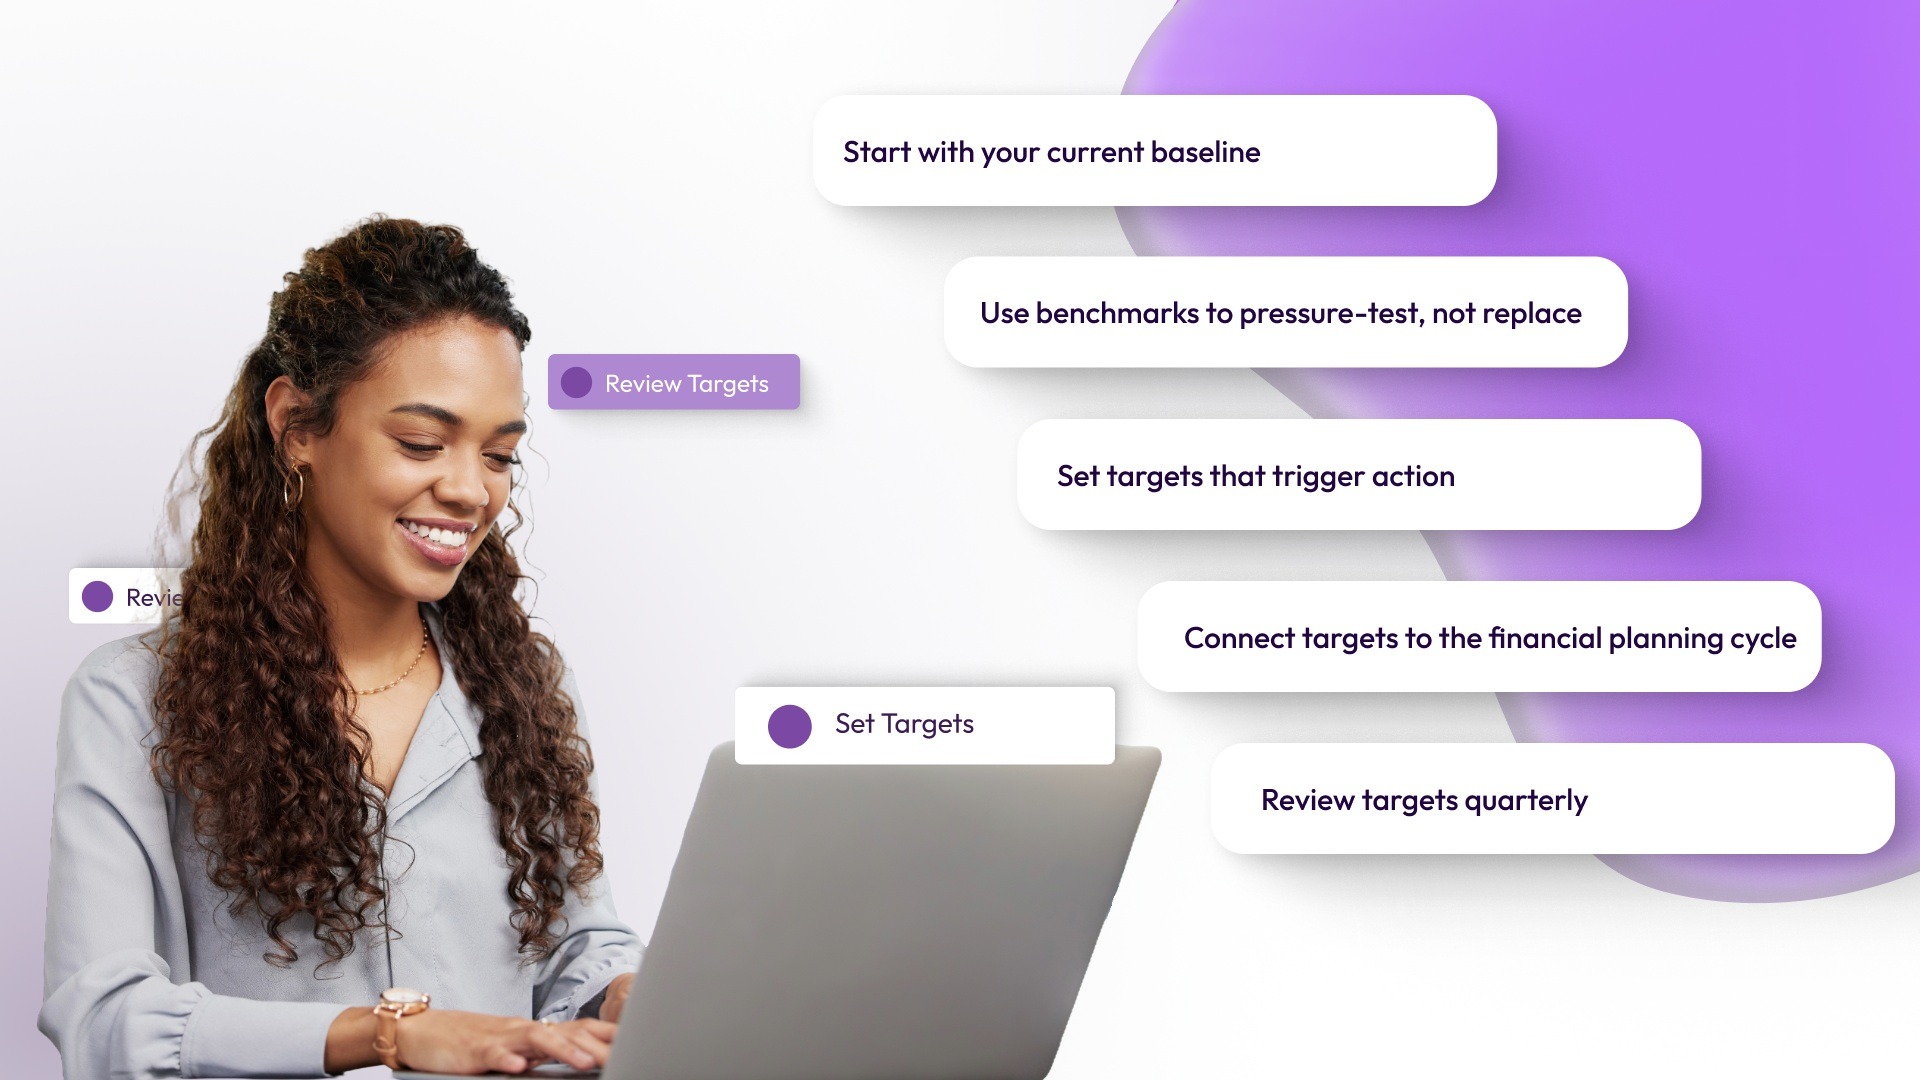
- Start with your current baseline. Pull the last 12 months of data for each KPI. That is your starting point, not industry averages, which may not reflect your stage, geography, or business model.
- Use benchmarks to pressure-test, not replace. Industry benchmarks are useful for checking whether your numbers are realistic. They should inform your targets, not set them. A benchmark that works for a 5,000-person enterprise rarely applies to a 200-person SaaS company.
- Set targets that trigger action. A useful target has two levels: a threshold (where you start watching more closely) and a trigger (where you act). For voluntary turnover, a threshold might be 14%, and a trigger might be 18%.
- Connect targets to the financial planning cycle. KPI targets set in isolation from the budget plan quickly become irrelevant. Headcount vs. plan targets should align with the model Finance has developed. Compensation spend targets should reflect the same revenue projections the CFO is working from.
- Review targets quarterly. A target set at 100 employees becomes outdated at 200. The right cadence for target review is quarterly at a minimum during rapid growth, even if the KPI itself is reviewed monthly.
Suggested Read: Best All-in-One Workforce Management Software 2025
Three Workforce KPI Tracking Mistakes That Quietly Cost You
Even with the right KPIs in place, how you track and review them determines whether they actually help you make better decisions. These are the three most common mistakes that reduce the usefulness of KPIs for People Ops teams.
Tracking Company-Wide Averages Instead of Distributions
A 14% company-wide voluntary turnover rate can hide a 30% rate in one department and a 6% rate everywhere else. The average looks manageable. The problem inside it is expensive. KPIs broken down by department, tenure band, location, and manager are where the actionable signal lives. Build your tracking structure to produce distributions, not summary averages.
Treating Workforce KPI Reviews as a Once-a-Quarter Exercise
At a company adding 20 or more people per quarter, a quarterly view is already 60 to 90 days behind the actual situation. Compensation spend crossing a threshold in month two of a quarter should surface before the quarter closes, not during year-end planning. The KPIs that drive the most useful decisions are the ones reviewed on a rolling or monthly basis, not assembled at the start of budget season.
Relying Entirely on Lagging Indicators
By the time voluntary turnover climbs, the pay compression or career growth problem that caused it has usually been building for months. By the time the cost per hire spikes, the sourcing strategy that drove it has already run its course. Include at least two leading indicators in your KPI set.
Pay compression ratio, offer acceptance rate trend, and open role aging are the three most useful for growth-stage companies. They give you a window to act before the lagging number confirms the problem.
Suggested Read: How to Excel in Talent and Workforce Planning?
How CandorIQ Supports Workforce KPI Tracking?
CandorIQ helps People Ops leads centralize compensation and headcount planning so they can bring Finance-ready data into every planning conversation, without the manual reconciliation step in between.
For the KPIs in this guide, that means:
- Headcount vs. plan can be tracked continuously against approved budgets, so the number you bring to Finance is current, not three weeks old.
- Compensation spend by department, role, and level is visible alongside the financial plan, so you and Finance are reading from the same source.
- Pay compression can be surfaced by comparing current salaries against pay band midpoints across the workforce, so the risk is visible before a merit cycle catches it.
- Offer acceptance rate sits alongside pay band data, so when a function's compensation range falls below what the market will accept, you can see the connection before the next candidate declines.
CandorIQ integrates with more than 150 HR systems, including HRIS, ATS, and cap table tools, so the data feeding these KPIs comes from the systems your team already uses rather than manual imports.
Final Thoughts!
Workforce KPI tracking becomes useful when it moves beyond reporting and begins to guide decisions. A focused set of metrics helps you connect hiring, compensation, and retention to actual business impact, rather than tracking disconnected data points. The goal is not to measure everything, but to track what you can act on with confidence and consistency.
CandorIQ helps People Ops teams bring headcount and compensation data into one place, so KPI tracking stays accurate and aligned with planning.
If your current setup still relies on disconnected systems, book a demo to see how CandorIQ makes your workforce data easier to track and use.

FAQs
1. Which KPI should be tracked for workforce efficiency?
Revenue per employee is a widely used KPI for workforce efficiency, as it reflects how effectively your workforce generates output relative to total headcount and cost.
2. What is the best KPI to track?
There is no single best KPI to track, but headcount vs. plan is highly useful, as it directly links hiring activity to budget, planning accuracy, and execution.
3. What are the 4 pillars of the workforce?
The four pillars of the workforce are workforce planning, talent acquisition, performance management, and employee retention, each supporting sustainable growth, productivity, and long-term organizational stability.
4. How to measure workforce performance?
Workforce performance is measured using KPIs such as revenue per employee, voluntary turnover rate, and time to fill, and is analyzed by segment to identify trends and issues.
5. What are the 5 R's of workforce planning?
The five R's of workforce planning are right size, right skills, right shape, right site, and right spend, ensuring alignment between workforce capability and business needs.
Ready to modernize your workforce and compensation strategy?
See how CandorIQ brings workforce planning and compensation together with AI.