Comprehensive Guide to HR Analytics and Reporting
Unlock the power of HR analytics and reporting. Learn key strategies, tools, and best practices to optimize workforce data and improve decision-making.

Are you making decisions for your people based on gut feel and outdated spreadsheets? Most growing companies are. The HR analytics market is projected to reach nearly $9.89 billion by 2031, growing at almost 14.9% annually.
Yet many mid-sized organizations still struggle with fragmented compensation data and headcount chaos. This disconnect costs you real money. Overhiring burns runway. Poor compensation planning kills retention. Manual reporting eats your team's time.
This guide is built for CPOs, CFOs, and People Ops leaders who are done guessing. You're scaling fast with lean teams. You need workforce analytics that actually drives budget governance and strategic decisions.
We'll show you how to transform scattered HR data into your competitive advantage.
At a glance:
- HR analytics turns gut feelings into data-driven strategies that boost cash flow, retention, and hiring, key for scaling companies with lean teams.
- Data fragmentation is a major barrier to success, causing overhiring, poor compensation planning, and wasted time.
- Three key analytics levels are descriptive (What happened), predictive (What will happen), and prescriptive (What to do). Start with descriptive and scale as you mature.
- Focus on 10 core metrics: Turnover rate, cost per hire, time to fill, offer acceptance rate, revenue per employee, and workforce cost %.
- The biggest mistake is asking the wrong questions: Define business problems (e.g., "Can we afford our hiring plan?") before building dashboards.
- Integrated data infrastructure is essential: Your HRIS, payroll, and recruiting systems must work together for accurate decisions.
- Analytics drives action: Use data to adjust timelines, reallocate budgets, and forecast costs to safeguard growth.
What is HR Analytics and Reporting
HR analytics replaces gut-feel decisions with data-driven insights. It's not about collecting more data. It's about using the right data to answer critical business questions.
Every hiring decision, every compensation adjustment, every headcount plan affects your burn rate. HR analytics shows you exactly where your people investments are working, and where they're not.
What HR Analytics Actually Includes
HR analytics combines workforce data with analysis methods to identify trends and inform strategic decisions. For growing companies, this means:
- Headcount planning: Who you need, when you need them, and what it costs
- Compensation analysis: Market benchmarking, pay equity, and budget forecasting
- Retention metrics: Which teams are bleeding talent and why
- Hiring efficiency: Time-to-fill, cost-per-hire, and pipeline health
The Three Levels You Need to Know
There are three levels of analytics in HR reporting:
- Descriptive Analytics: Summarizes historical data into understandable reports, like headcount by department. This answers "what happened."
- Predictive Analytics: Uses patterns in employee activity and statistical analysis to forecast future workforce trends. This answers "what will happen."
- Prescriptive Analytics: Recommends specific actions to optimize processes and achieve desired outcomes. This answers "what should we do."
Most growing companies start with descriptive analytics. The goal is to climb the ladder as your data maturity increases. The real question is: where do you apply them to create measurable business impact?
Where HR Analytics Actually Drives Impact
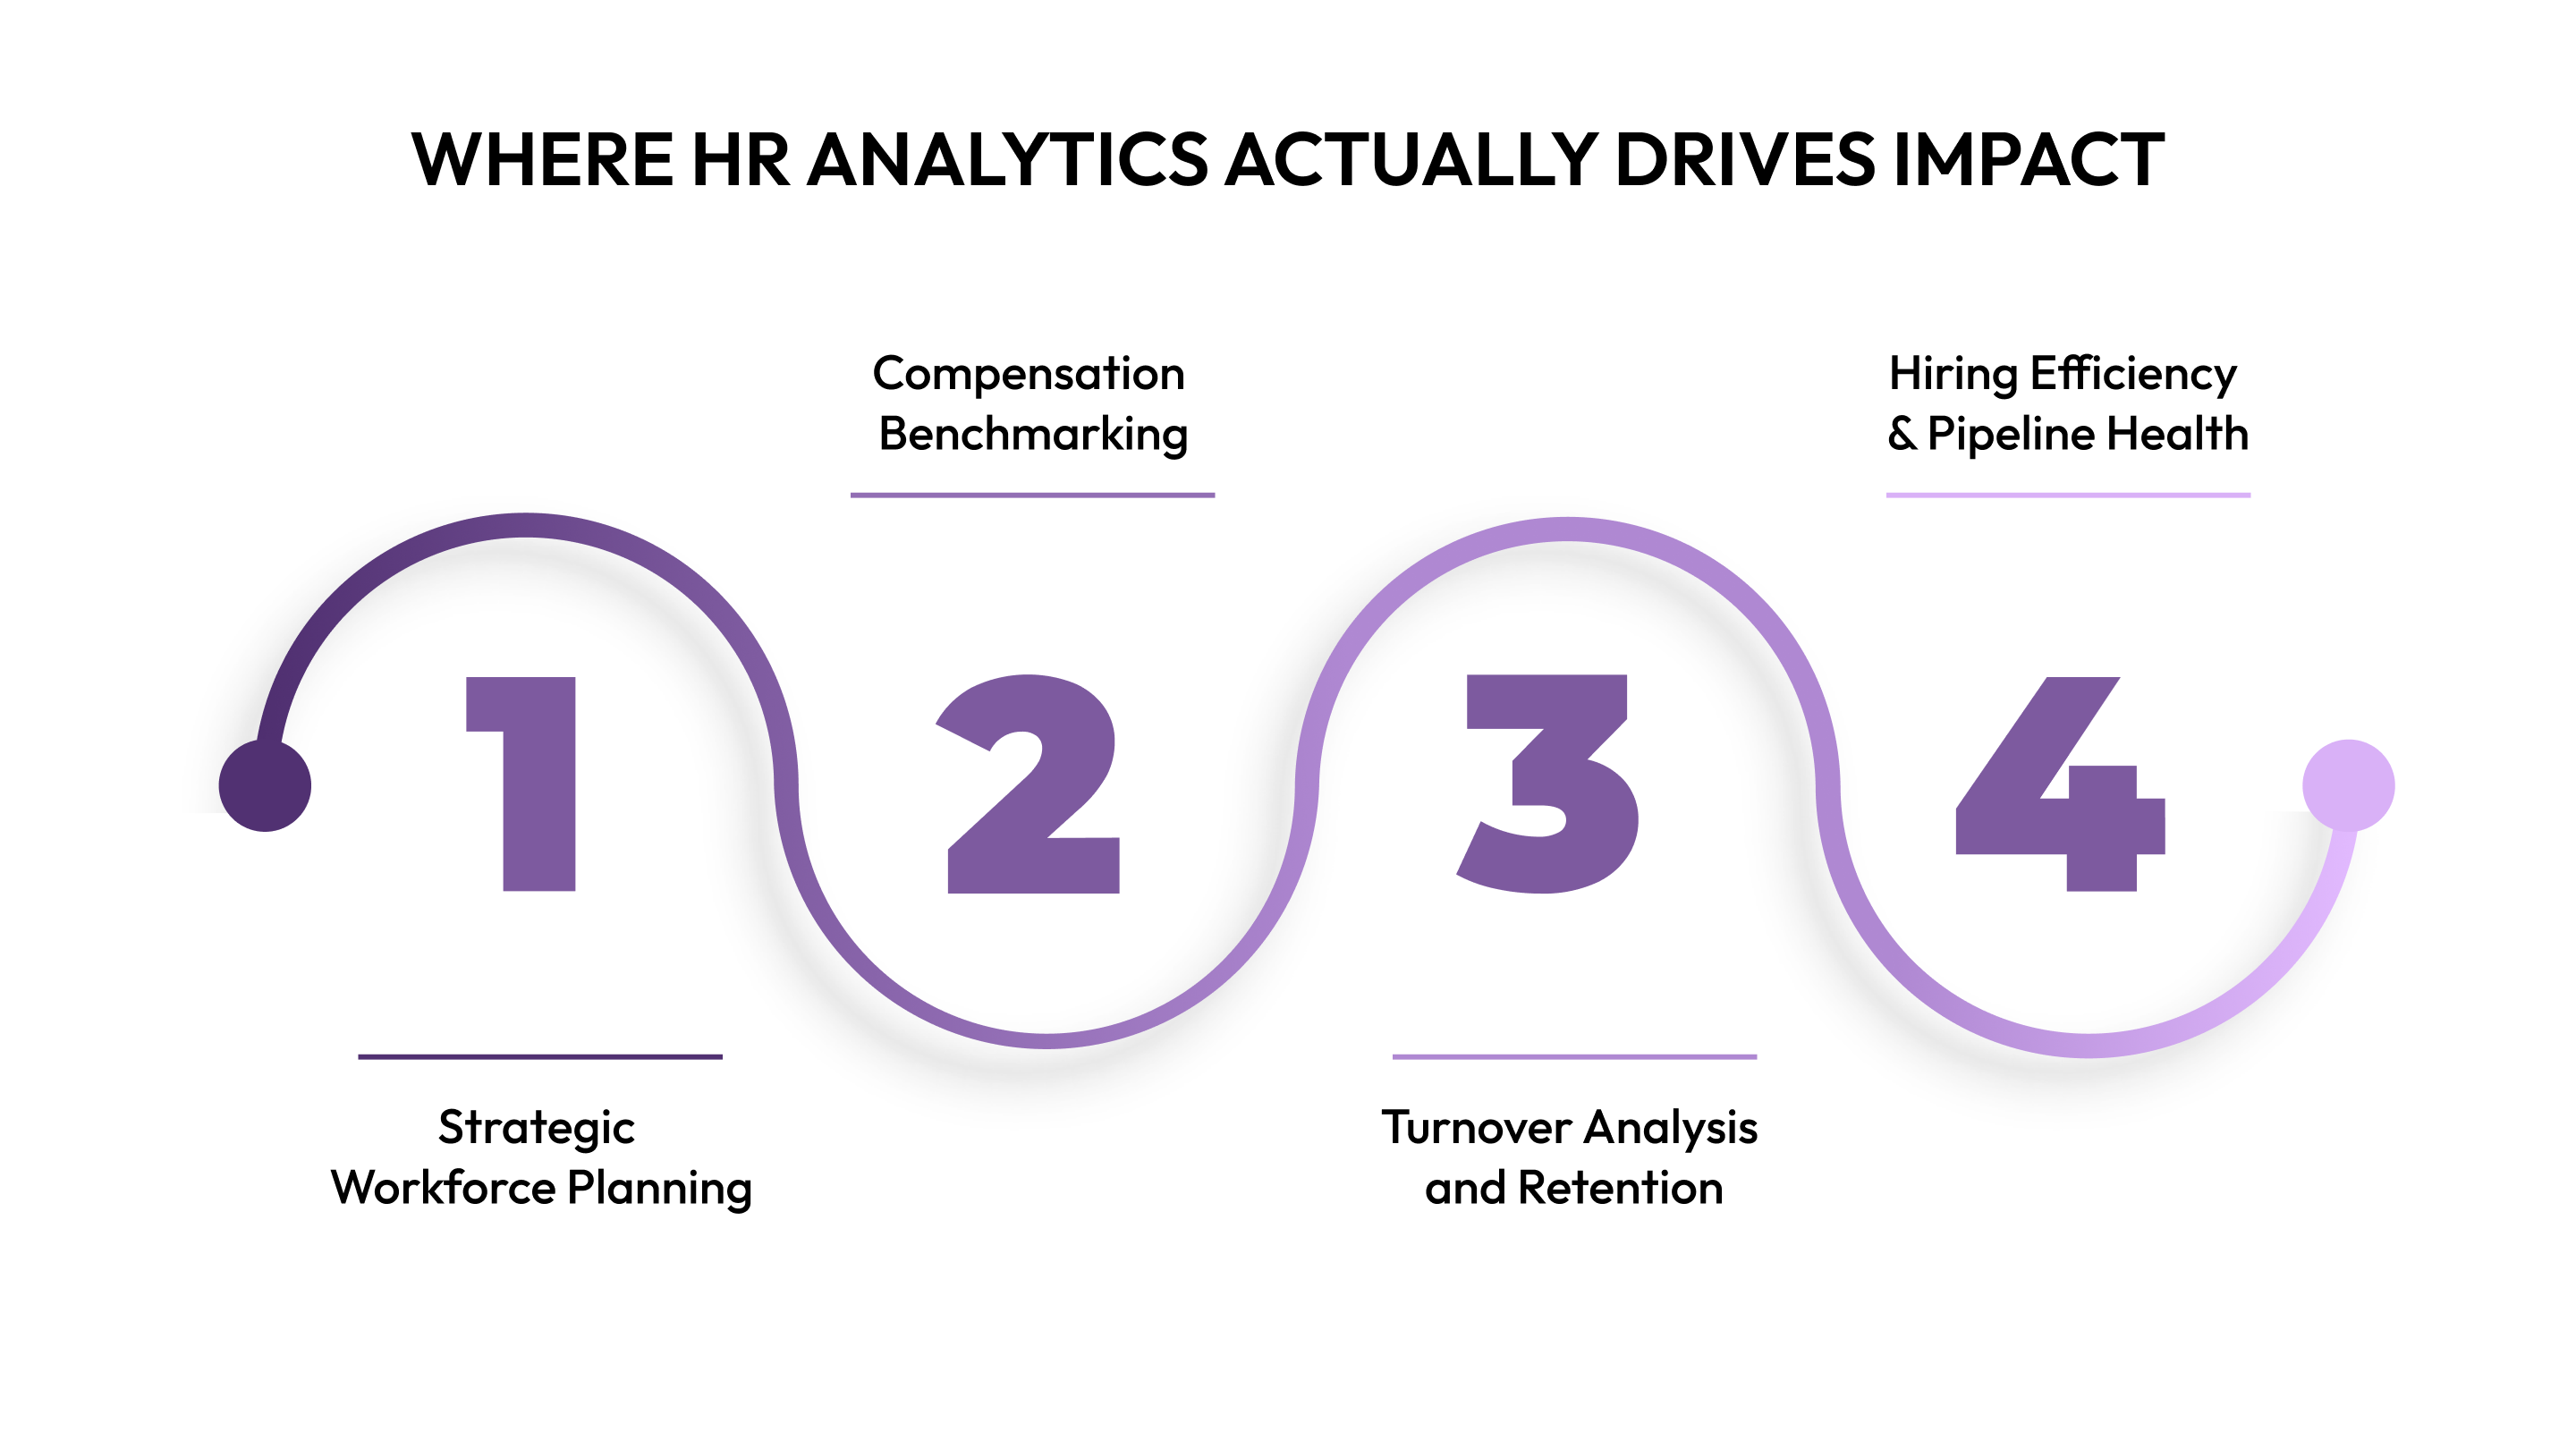
Now that you know what HR analytics is, let's talk about where it matters most. These aren't theoretical use cases, they're the decisions that directly affect your cash flow and competitive advantage.
1. Strategic Workforce Planning
Companies using predictive analytics for workforce planning have reduced hiring costs by 30%. The key is matching hiring plans to actual business needs, not just filling seats.
You can forecast:
- Headcount needs by quarter based on growth targets
- Budget impact of different hiring scenarios
- Skill gaps before they become critical bottlenecks
Analytics helps identify candidates likely to succeed and reduces turnover by analyzing risk factors like job satisfaction and performance metrics. Developing effective workforce strategies starts with understanding these predictive patterns before they become problems.
2. Compensation Benchmarking and Budget Control
Paying too little loses you talent. Paying too much burns runway unnecessarily.
Compensation benchmarking helps attract and retain top talent with competitive pay while staying within budget and supporting pay equity. For distributed teams, this means understanding regional market rates and adjusting accordingly.
The data shows what fair looks like:
- Market rates by role, experience, and location
- Internal pay equity across teams
- Total compensation costs, including benefits and equity
3. Turnover Analysis and Retention
Benchmarking helps visualize how your company compares against competitors in your industry. But raw turnover numbers don't tell the whole story.
Analytics reveals:
- Which departments or managers have retention issues
- Early warning signs before top performers leave
- Cost impact of replacing key roles
Analytics identifies trends like increasing turnover rates or high absenteeism in specific departments, helping HR pinpoint areas needing improvement. If you're struggling with retention, learn how to reduce employee attrition using HR analytics with data-driven strategies that actually work.
4. Hiring Efficiency and Pipeline Health
Every open role costs you velocity. Analytics shows where your hiring process breaks down.
Track what matters:
- Time-to-fill by role and seniority
- Offer acceptance rates and why candidates decline
- Cost-per-hire, including recruiter time and tools
This helps you spot inefficiencies before they become expensive problems. However, impact without infrastructure is just wishful thinking.

The Building Blocks That Make HR Analytics Work
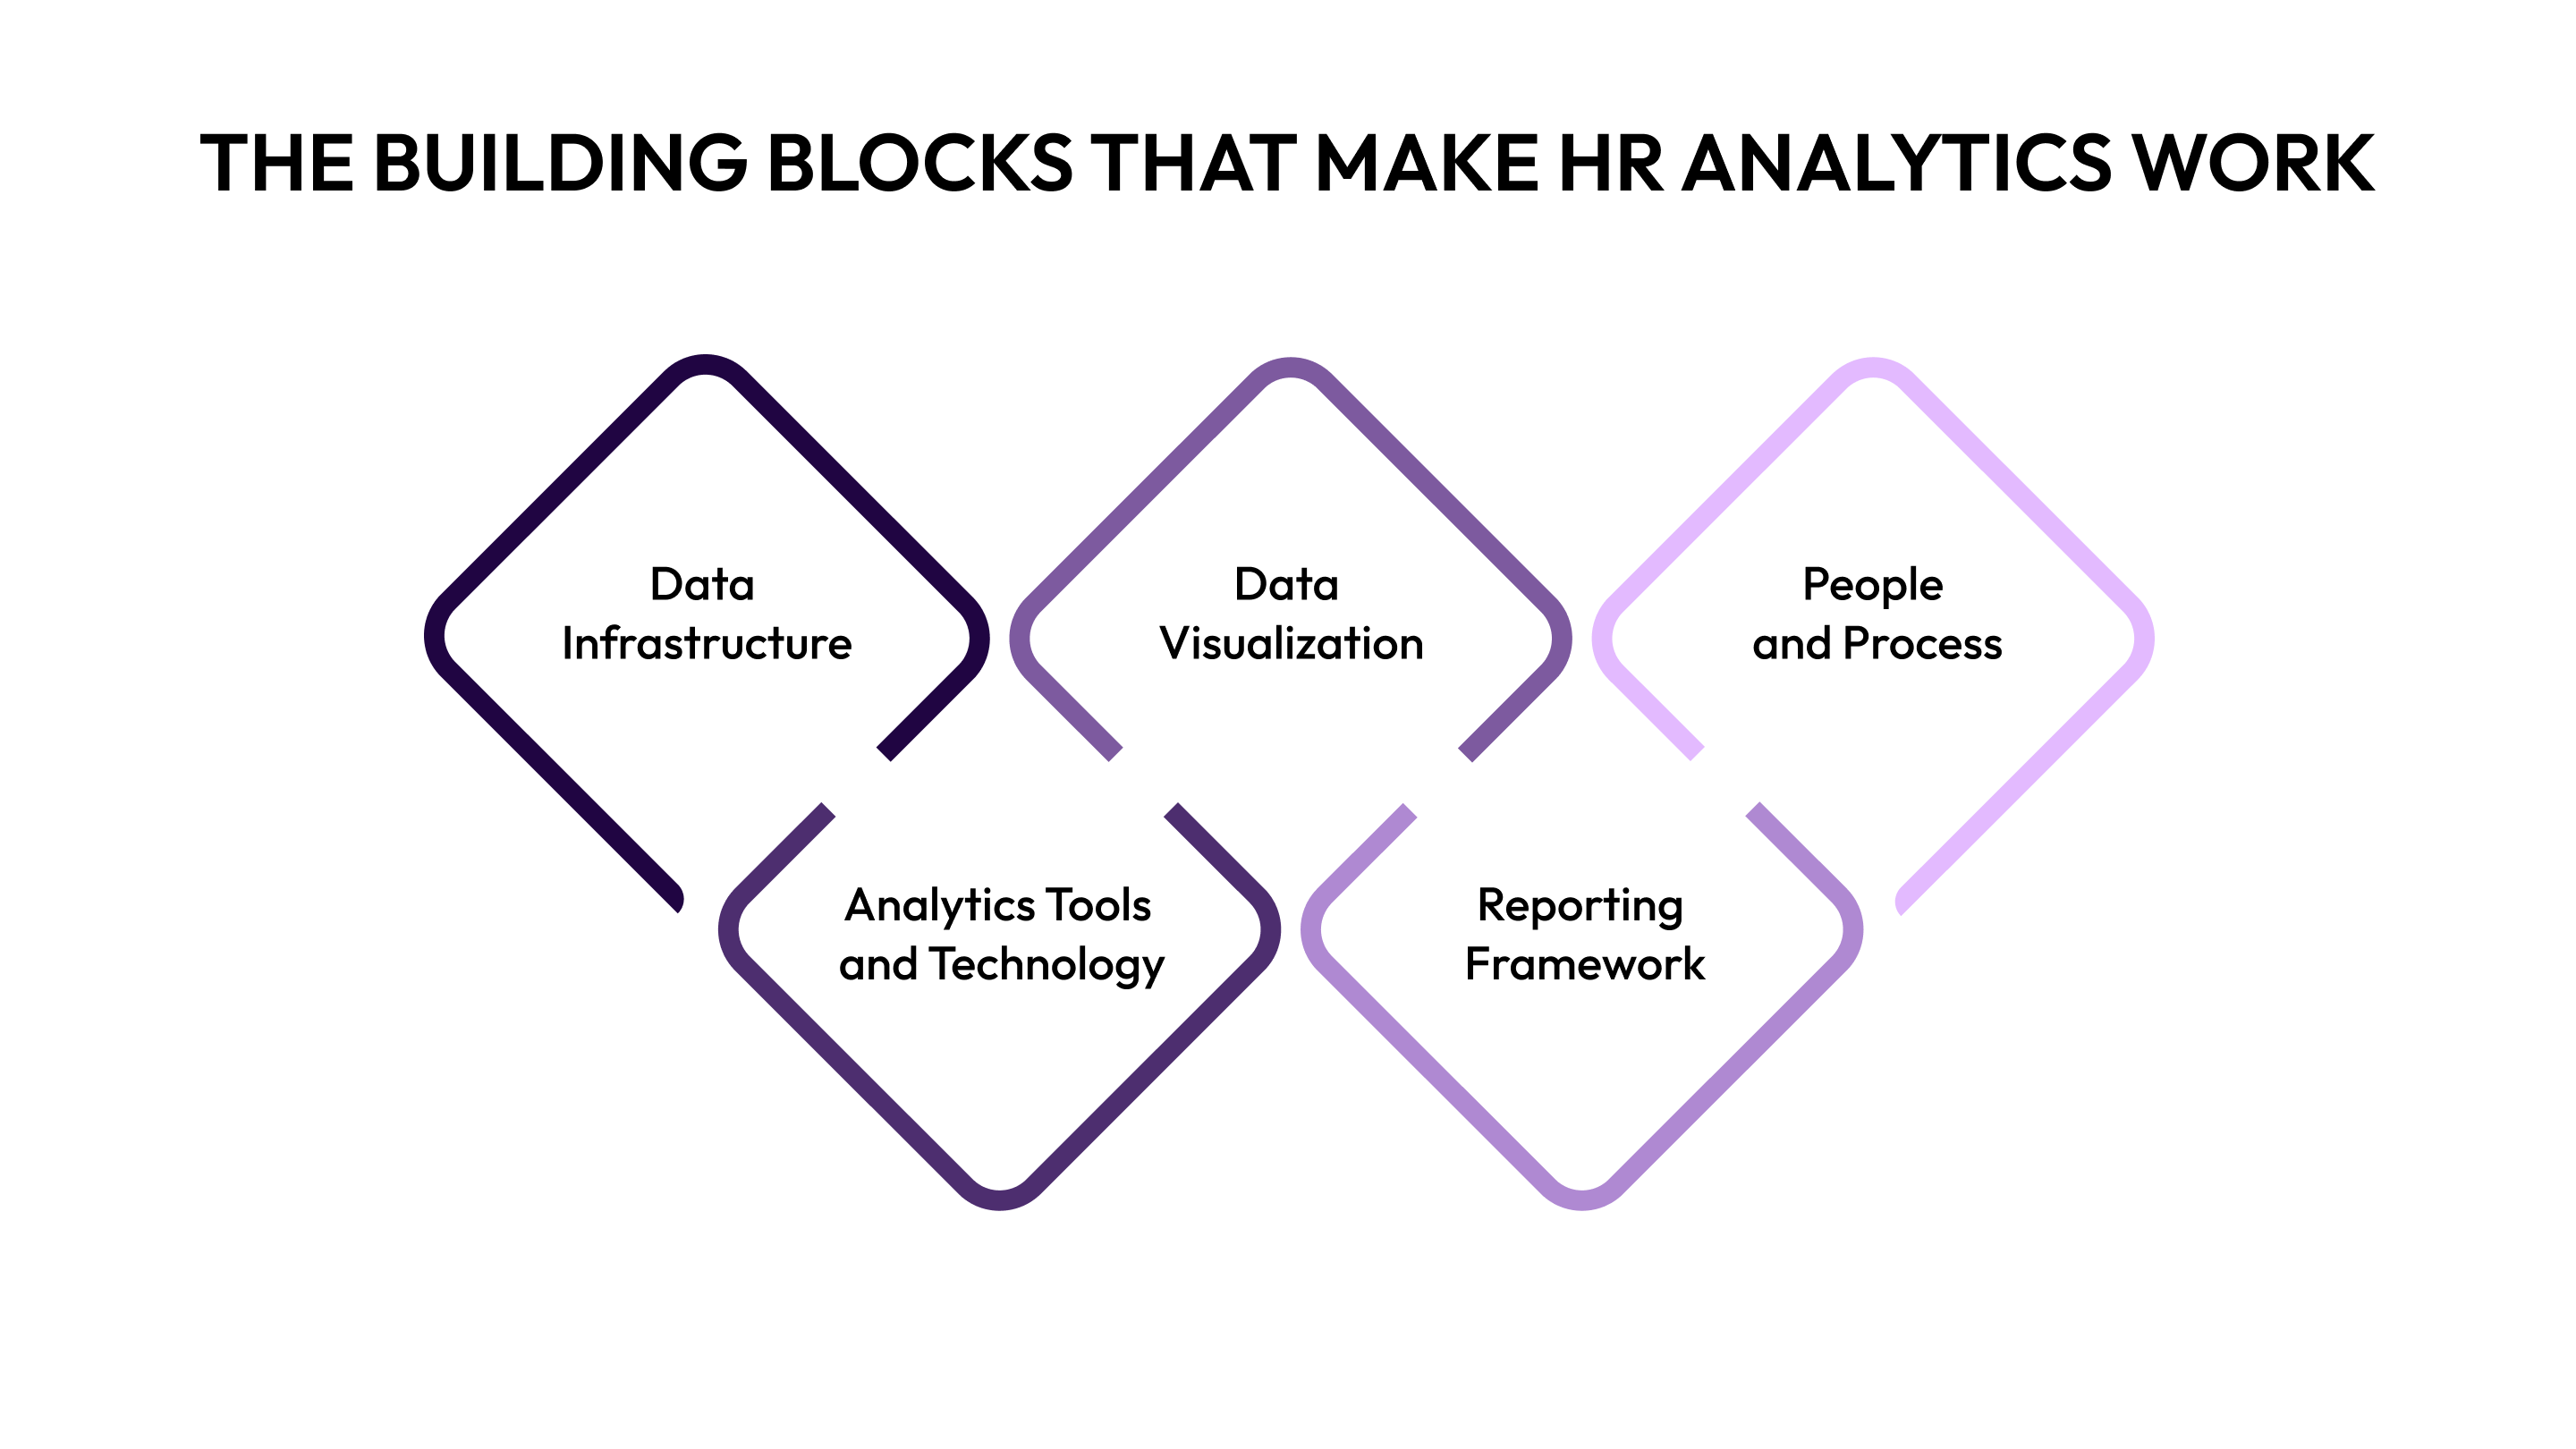
You can't build analytics on hope and spreadsheets. Here are the essential components you need to make HR analytics actually function in your organization.
1. Data Infrastructure
HR technology in 2024 is driven by AI, data analytics, and employee experience platforms that streamline processes and enhance decision-making. AI is transforming how companies approach learning and development, and it's reshaping workforce planning too.
Build your foundation with:
- HRIS: A single source of truth for employee records, compensation, and org structure.
- Integration layer: Connects payroll, recruitment, and performance systems.
- Data warehouse: A centralized hub for all HR data.
Fragmented systems hinder analytics; ensure everything is integrated for smooth data flow.
2. Analytics Tools and Technology
The right tool depends on your team's technical capability and budget.
Common categories include:
- Business intelligence platforms: Power BI, Tableau for custom dashboards
- Purpose-built HR analytics: You can use CandorIQ for pre-configured workforce metrics
- Spreadsheet-based tools: Excel or Google Sheets for lean teams starting out
Don't overcomplicate this. Start with what your team can actually use today.
3. Data Visualization and Dashboards
Transform complex data into easy-to-understand visuals, showing:
- Trends over time
- Comparisons across departments
- Outliers needing attention
An HR dashboard is a business intelligence tool that allows Human Resource teams to track, analyze, and report on HR KPIs. The best dashboards answer questions at a glance.
For deeper insights into HRMS analytics and reporting capabilities, understanding how modern systems visualize workforce data can transform your decision-making speed.
4. Reporting Framework
Reports without context are just numbers. Your reporting framework should connect data to decisions.
Build reports for specific audiences:
- Executive summaries: High-level trends and financial impact
- Operational reports: Weekly or monthly tracking for hiring managers
- Ad-hoc analysis: Deep dives into specific problems or opportunities
Make every number actionable.
5. People and Process
Analytics requires skilled people to ask the right questions and interpret answers:
Essential roles include:
- Data steward: Ensures data quality and consistency
- Analytics lead: Translates business questions into analysis
- Stakeholder champions: CFOs and CPOs who actually use the insights
Analytics helps you make those changes based on evidence, not assumptions. The goal isn't building a perfect analytics infrastructure. It's building something that works for your current stage and scales as you grow. So, not every metric deserves your attention.
The 10 HR Metrics That Actually Matter in 2025
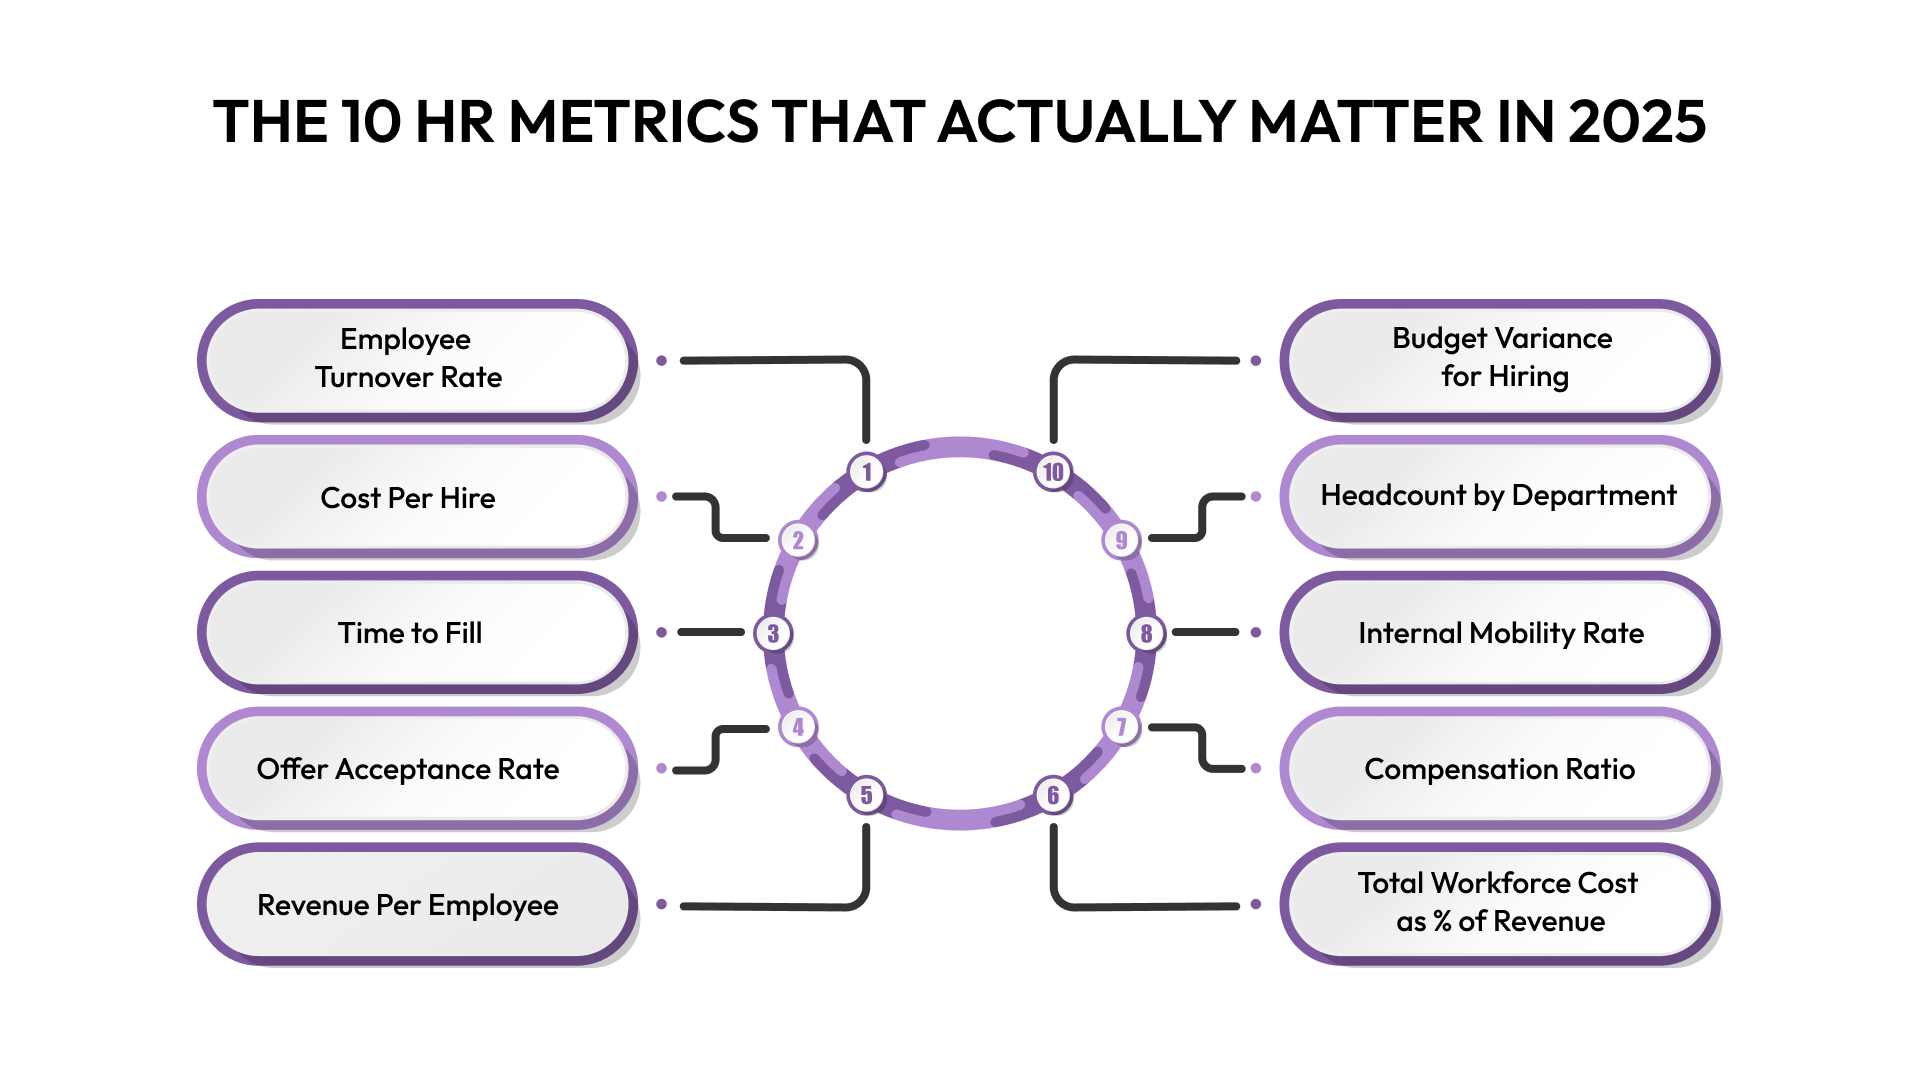
You've built the foundation. Now track the metrics that directly impact your bottom line. These aren't vanity numbers; they're the KPIs that tell you if your people strategy is working or burning cash.
- Employee Turnover Rate: Tracks the percentage of employees leaving over a specific period. High performers leaving signals retention problems that directly impact your budget and team stability.
- Cost Per Hire: Measures total recruiting expenses per new hire. Essential for budgeting and identifying recruiting inefficiencies that drain resources.
- Time to Fill: Days from opening a role to accepted offer. Longer timelines mean lost productivity and candidates accepting competing offers.
- Offer Acceptance Rate: Percentage of offers accepted versus declined. Low rates indicate compensation misalignment or poor candidate experience. Critical for diagnosing why you're losing talent at the finish line.
- Revenue Per Employee: Total revenue divided by headcount. Shows workforce efficiency and whether your hiring pace matches growth. Declining ratios signal overhiring or productivity issues.
- Total Workforce Cost as % of Revenue: All people expenses as a percentage of revenue. Your people burn rate directly impacts runway and profitability.
- Compensation Ratio: How your pay compares to market benchmarks by role and location. Essential for retention and budget control. Underpaying loses talent, and overpaying without a strategy wastes cash.
- Internal Mobility Rate: Percentage of employees moving to new internal roles. Shows whether you're developing talent or forcing them to leave for growth. Higher mobility improves retention and reduces external hiring costs.
- Headcount by Department: Employee distribution across teams. Reveals where you're investing and whether team sizes align with business priorities and revenue contribution.
- Budget Variance for Hiring: Gap between planned and actual headcount spend. Monthly tracking prevents runway surprises. Overruns burn cash faster than planned, and underruns indicate hiring delays slowing growth.
The bottom line is to Track metrics that drive financial decisions. Everything else is noise. Optimizing performance through effective HR analytics means obsessing over these core metrics until they become second nature. Read on to know how to actually implement them.
.png)
Best Practices to Get Started with HR Analytics in 2025
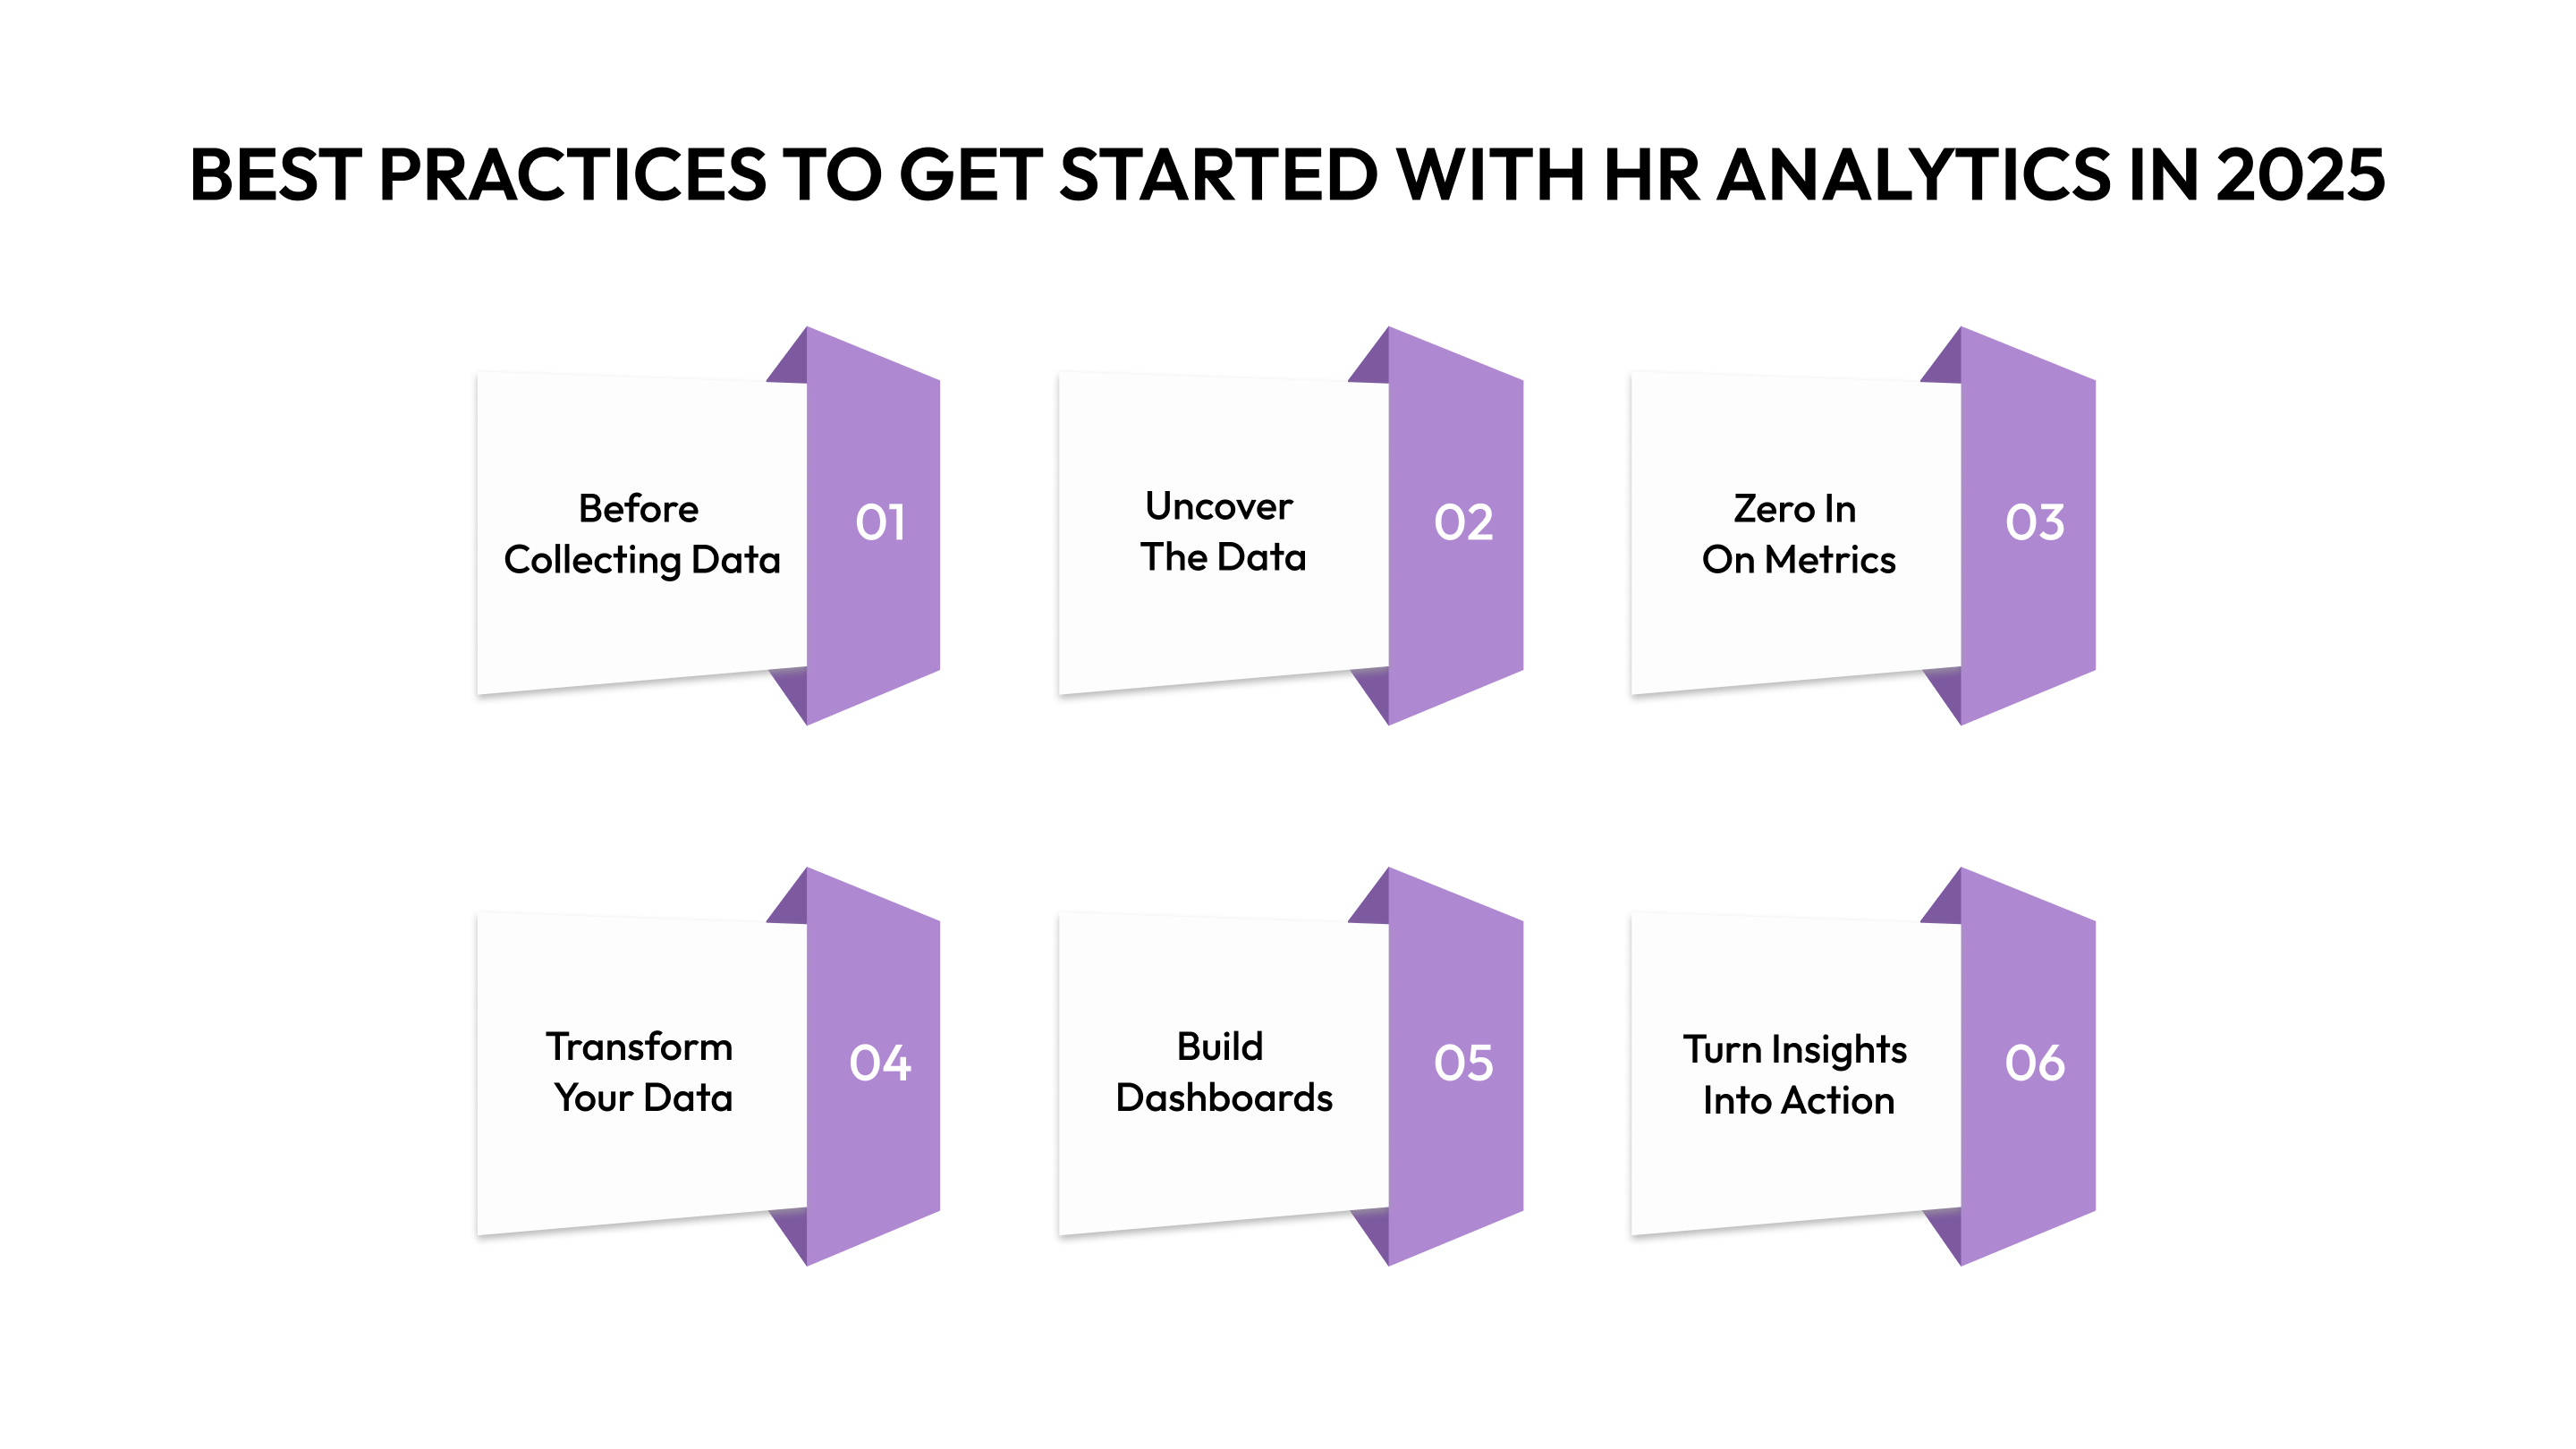
Understanding the value is one thing. Building it into your operations is another. Here's how to implement HR analytics without adding complexity to your already stretched team.
Tip 1: Ask the Right Questions Before Collecting Data
Start by defining what you need to know, not just how to gather data.
Key questions might include:
- Can we afford our hiring plan?
- Are we paying competitively?
- Which teams have retention issues?
Your analytics should solve real business problems, not just churn out reports.
Tip 2: Uncover the Data You Already Have
Audit existing systems before diving into analysis.
Look for data across:
- HRIS
- Payroll & compensation platforms
- Applicant tracking & performance tools
The problem isn’t a lack of data; it’s fragmented data across too many systems.
Tip 3: Zero In on Metrics That Matter
Focus on metrics directly linked to financial outcomes:
- Cost of workforce: Total compensation as % of revenue
- Time-to-fill: Days from opening to accepted offer
- Turnover rate: Percentage of employees leaving by department
Track fewer metrics, but dive deep into what truly drives business success.
Tip 4: Clean and Transform Your Data
Remove errors and inconsistencies from your data.
Pay attention to:
- Job titles and levels
- Location data for distributed teams
- Compensation details (base, bonus, equity)
Clean, consistent data ensures you’re making decisions based on accurate information.
Tip 4: Build Dashboards That Actually Get Used
Design dashboards tailored to the needs of your audience.
Focus on:
- CFOs: Budget burn, cost-per-hire, workforce projections
- CPOs: Retention trends, diversity, compensation benchmarks
- Hiring managers: Pipeline health, offer conversion rates
Make your dashboards visual and easy to interpret. Trends are more useful than static numbers.
Tip 5: Turn Insights Into Action, Not Just Reports
Analytics should drive strategy and decision-making.
Use your insights to:
- Adjust hiring timelines based on actual time-to-fill data
- Reallocate budgets to teams with high retention risk
- Benchmark compensation to keep top talent
- Forecast headcount costs for smarter planning
Transform data into decisions that move your business forward.
Conclusion
HR analytics and reporting help you make smarter decisions with the data you already have. From strategic workforce planning to compensation benchmarking, the right analytics framework transforms scattered information into actionable insights that protect your runway and accelerate growth.
The challenge for most growing companies isn't understanding why analytics matters. It's finding a system that actually works without adding operational overhead to your lean team.
CandorIQ was built specifically for this problem, combining HRIS, compensation planning, and workforce analytics into one platform that scales with you. If you're tired of fragmented data and manual reporting eating your time, book a demo to see how CandorIQ helps companies like yours turn workforce data into a competitive advantage.
Frequently Asked Questions
1. What's the difference between HR analytics and people analytics?
HR analytics focuses on operational HR metrics (e.g., turnover, time-to-hire), while people analytics takes a broader view, analyzing how people affect business outcomes like productivity, culture, and team dynamics. The focus should be on tracking metrics that drive financial decisions.
2. How do I convince leadership to invest in HR analytics tools?
Highlight ROI and risk mitigation by calculating the cost of bad hires, unplanned headcount overruns, and manual reporting inefficiencies. Present a pilot project that addresses an immediate pain point like turnover prediction or compensation benchmarking.
3. Is HR analytics only for large enterprises, or can startups benefit too?
Startups can benefit more as each decision has a larger impact. HR analytics helps prevent mistakes like overhiring, inconsistent pay, and losing talent, critical for scaling with limited resources.
4. How long does it take to see results from implementing HR analytics?
Quick wins, like compensation benchmarking, can happen in 30-60 days. Building a comprehensive system with predictive analytics takes 6-12 months, depending on data infrastructure and team capacity.
5. What skills do I need to work in HR analytics?
Core skills include data literacy, proficiency in Excel/Google Sheets, and business acumen. Advanced roles may require SQL, data visualization tools (e.g., Tableau, Power BI), and statistical analysis.
6. Can HR analytics help with diversity, equity, and inclusion (DEI) initiatives?
Yes. HR analytics helps identify pay equity gaps, track diversity across levels, and monitor promotion rates, making bias visible and helping measure DEI progress over time.
Ready to modernize your workforce and compensation strategy?
See how CandorIQ brings workforce planning and compensation together with AI.