

How HR Analytics Insights Drive Smarter People Decisions in 2026
Discover 7 proven HR analytics insights to cut attrition, optimize headcount, and align compensation strategy in 2026, built for scaling US companies.
.jpg)

In 2026, U.S. HR teams are tasked with managing headcount, compensation, and retention amidst increasingly complex data challenges. However, many teams are still making decisions based on incomplete data, risking poor decisions that directly impact talent retention, budget alignment, and offer competitiveness.
HR analytics insights are the key to transforming this approach, turning data into actionable decisions that keep your organization competitive and your talent engaged
According to SHRM, replacing an employee in the U.S. can cost between 50% to 200% of their annual salary. Yet a 2024 Gartner survey found that only 15% of HR leaders are satisfied with how they use data to guide people decisions. The rest are managing headcount planning, compensation reviews, and retention strategy with incomplete inputs and outdated reports.
The companies getting this right treat HR analytics as a decision system, not just reporting. This blog explores which insights actually drive outcomes, the metrics that matter, and why distributed U.S. teams feel the impact most.
Key Takeaways
- HR analytics insights go beyond reporting. They guide what to do next, not just explain what already happened.
- The five types of analytics, descriptive, diagnostic, predictive, prescriptive, and real-time, each answer a different question, and scaling U.S. teams need all five to make confident decisions.
- A focused set of metrics, from compa-ratio to headcount vs. plan variance, has the clearest impact on retention, pay equity, and workforce efficiency in 2026.
- Distributed teams face compounding data challenges: fragmented systems, multi-state compliance, and limited analyst support make execution harder without the right infrastructure.
- CandorIQ brings compensation, headcount, and people data into one system, giving CPOs, CFOs, and People Ops teams the real-time visibility needed to act quickly and make better decisions.
What HR Analytics Insights Actually Mean For Headcount And Compensation In 2026
Most teams already have data. The gap is in turning that data into decisions. For years, HR operated in report mode. Headcount, compensation, and performance data lived in separate systems, and connecting them required time, analysts, and often a quarterly review cycle.
That model breaks at scale, especially in the U.S., where distributed teams, multi-state compliance, and fast-moving talent markets demand faster decisions.
By analyzing these in real-time, HR leaders can move from reactive problem-solving to proactive decision-making. For example, real-time compensation insights can help adjust pay scales before offers are rejected, while retention metrics can identify high-risk employees early, allowing for retention strategies to be put in place before attrition occurs.
.png)
5 Types of HR Analytics Insights Every Scaling Team Should Know
These 5 types of analytics are five different lenses on your workforce data. Each answers a different question. The most effective teams use them together, moving from visibility to action.
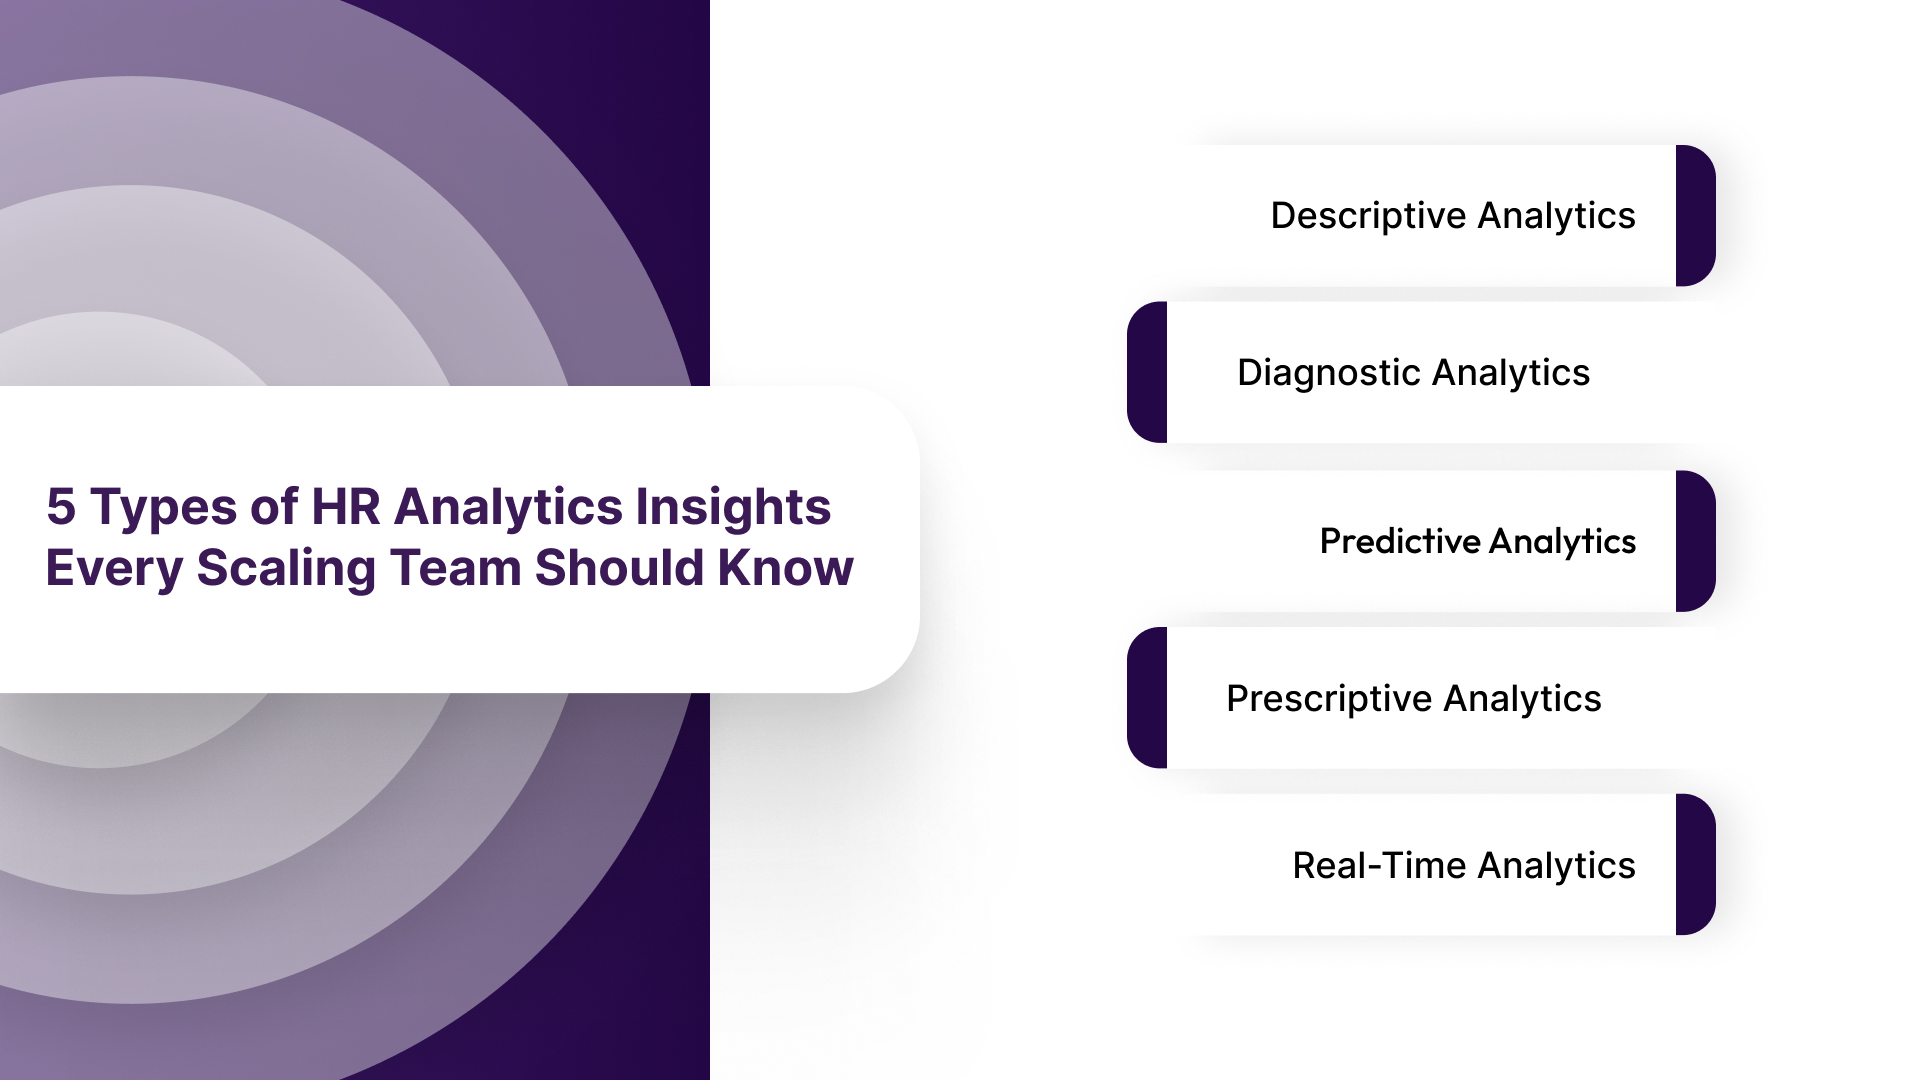
1. Descriptive Analytics
This gives you the baseline about what happened in the past. For example, headcount reports or turnover summaries tell you the status quo. But these numbers alone don’t answer the key question: Why did it happen, and how should you act? The real value comes when descriptive insights are used as the foundation for deeper analysis and informed decisions."
2. Diagnostic Analytics
Diagnostic analytics answers: why did it happen? This is where pattern recognition starts. A spike in attrition becomes a story tied to a specific team, tenure window, or compensation gap. It turns data into an explanation. For distributed teams, this often surfaces things you'd never catch in aggregate data.
3. Predictive Analytics
Predictive analytics answers: what's likely to happen next? This is the tier where HR starts to operate strategically. Predictive models flag employees at elevated flight risk before they resign, identify roles likely to go vacant, and surface comp bands drifting below market before they impact hiring or retention.
4. Prescriptive Analytics
Prescriptive analytics answers: what should we do about it? This layer moves from insight to action. Instead of just identifying a risk, it recommends the fix, whether that’s a targeted comp adjustment or a structural change in team design.
5. Real-Time Analytics
Real-time analytics answers: what's happening right now? Quarterly reports are too slow for distributed teams. Real-time analytics surfaces shifts as they happen, declining offer acceptance, regional engagement dips, or headcount gaps, so teams can act before issues compound.
Also Read: Effective Applications of HR Analytics in Performance Optimization
But what People leaders actually need to know is: which specific data points should I be tracking, and what decisions do they drive?
The 7 HR Analytics Insights That Move The Needle In 2026
These aren’t generic HR KPIs. Each one acts as a decision trigger—the kind of signal that changes what a CPO, CFO, or HRBP prioritizes next.
1. Compensation Ratio vs. Market Benchmark
Compa-ratio isn’t just an equity check. It’s a retention signal. When critical roles fall below ~90% of the market, you’re not just underpaying, you’re increasing exposure to external offers. Track this by role, level, and function. Clusters below range, especially in hard-to-fill roles, need immediate correction.
2. Time-to-Fill Paired with Offer Acceptance Rate
Time-to-fill alone is incomplete. The insight comes from pairing it with offer acceptance. If roles take longer to close while acceptance drops, the issue is compensation competitiveness. Together, these metrics tell you whether to fix recruiting workflows or pay bands.
3. Regrettable vs. Non-Regrettable Attrition
Total attrition lacks context. The real signal is who you’re losing. High performer exits, or losses in critical roles, point to structural issues. Separating regrettable from non-regrettable attrition reveals whether your retention problem is real or being masked by averages.
4. Manager Span of Control in Distributed Teams
This is often invisible until it breaks. When managers exceed ~8 direct reports, engagement and performance drop. In distributed teams, overspan is harder to detect but more damaging. It’s also a planning signal. Consistent overspan often means you’re underbudgeting for leadership roles.
5. Internal Mobility Rate and Retention Impact
Internal mobility is a leading indicator, not a lagging one. Organizations with strong mobility see significantly longer employee tenure because employees see growth internally. If mobility slows, expect retention issues to follow within the next few quarters.
6. Pay Equity Gaps by Level, Function, and Tenure
Pay equity is no longer optional. With growing transparency laws across U.S. states, gaps are increasingly visible, internally and externally. Tracking equity across multiple dimensions helps prevent compliance risk while reducing attrition and hiring friction.
7. Headcount Plan vs. Actual (The FP&A Gap)
The gap between planned and actual headcount directly affects revenue, capacity, and budget accuracy. Falling behind plan in key teams like sales or engineering isn’t just an HR issue. It’s an execution risk. Increasingly, Finance expects this data in real time, not at quarter-end.
The metrics are clear. So why aren't more scaling U.S. teams already tracking them? For distributed organizations, the barriers are specific, and they tend to stack.
Also Read: How AI Agents are Transforming HR Operations
.png)
Why Distributed U.S. Teams Struggle Most With HR Analytics
Understanding what to track is only half the equation. The harder problem is execution. For distributed U.S. teams, the barriers to acting on HR data are structural, and they compound quickly.
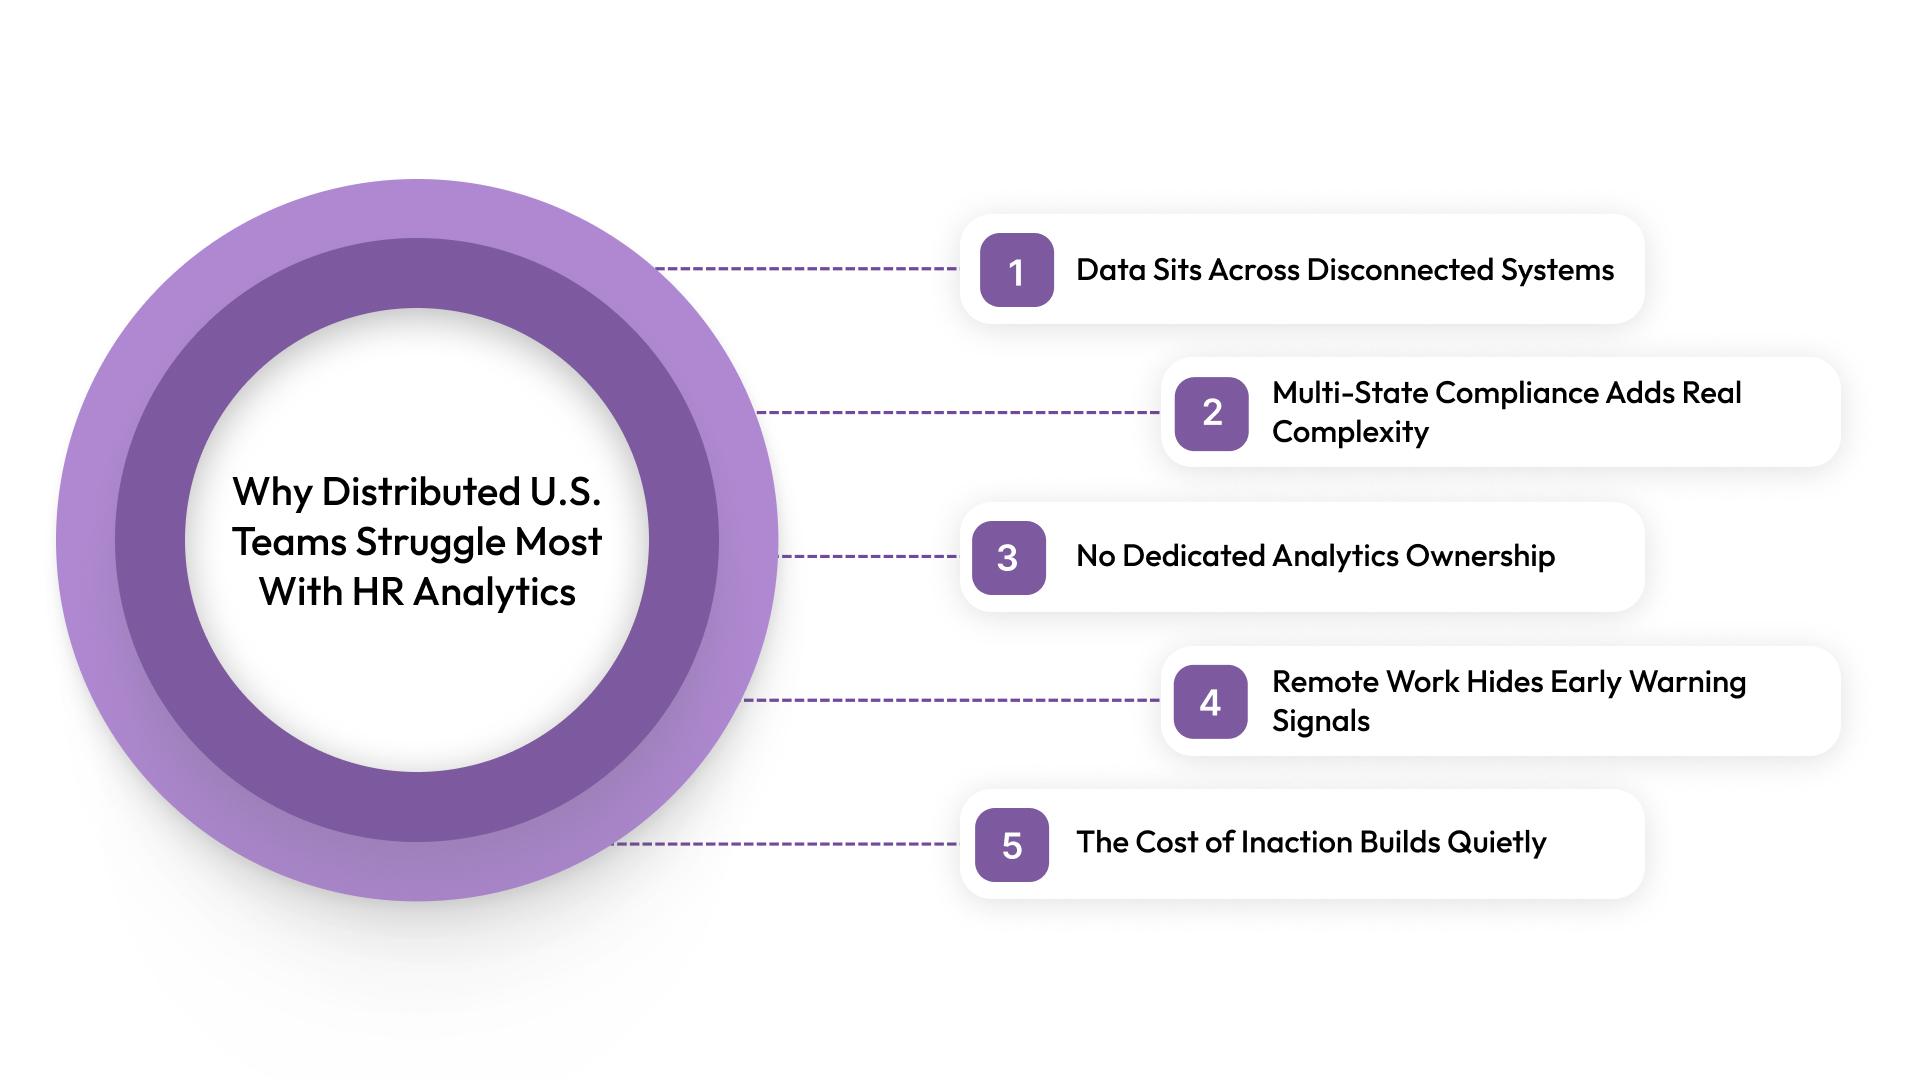
- Data Sits Across Disconnected Systems: Most mid-sized companies operate across an ATS, HRIS, payroll, performance tools, and spreadsheets, filling the gaps. These systems don’t integrate cleanly by default, which makes building a single, reliable view of headcount, compensation, and retention time-consuming and inconsistent.
- Multi-State Compliance Adds Real Complexity: Managing employees across states like California, New York, Texas, and Washington means pay equity analysis can’t rely on national averages. It has to be location-specific. Most tools aren’t built for that level of granularity, which leaves compliance risks hidden in plain sight.
- No Dedicated Analytics Ownership: With a lean team, recruiting, HR operations, and business partnering take priority. Analytics becomes an ad hoc task, handled when time allows, which is rarely enough to drive consistent decisions.
- Remote Work Hides Early Warning Signals: In distributed environments, issues like manager overspan, disengagement, or team imbalance don’t surface organically. Without structured data, these problems stay invisible until they start affecting performance or retention.
- The Cost of Inaction Builds Quietly: Most teams don’t feel the gap until it’s already expensive: multiple key exits in a quarter, or compensation drifting below market for over a year. By then, fixing the issue would have cost significantly more than maintaining visibility would have.
Now, you have recognized these barriers. But what a practical path forward looks like, especially for teams without the time or resources to build a full analytics function from scratch.
How to Build an HR Analytics Practice That Scales with CandorIQ
Building an analytics practice from scratch is the right instinct. But most scaling teams approach it by layering new tools onto an already fragmented stack. A dashboard on top of disconnected systems doesn’t fix the problem. It just shifts where the manual work happens.
The constraint isn’t visibility, it's structure. Compensation, headcount, and people data need to live in one place, accurate, current, and accessible to the teams making decisions. That’s the layer CandorIQ is designed to provide.
- Compensation & Pay Band Builder: Define pay bands by role, level, and location with geo-adjusted benchmarks built in. Visualize pay distribution across teams in real time and maintain version history for auditability, so every hiring or promotion decision is grounded in consistent, current data.
- Compensation Cycle Management: Run merit and bonus cycles with built-in approval workflows, live budget tracking, and in-platform collaboration. What used to require weeks of coordination across email and spreadsheets is completed in days, with full visibility into budget impact.
- Candidate Offer Experience: Present total compensation, salary, equity, bonus, and benefits in one place. Built-in equity modeling and contextual FAQs reduce back-and-forth, while giving candidates a clearer, more transparent view of their package.
- Headcount Scenario Planning: Model org changes and understand cost implications before committing. Compare hiring scenarios against budget constraints and align Finance and People teams on the same forward-looking view.
- Headcount Requests & Approvals: Standardize hiring requests with role context, budget alignment, and dynamic approval routing. Sync directly with ATS and finance systems to eliminate manual handoffs and speed up decision-making.
- Workforce Management Visibility: Track open roles, filled positions, attrition, and promotions in a single view. Compare actuals vs. plan across both headcount and compensation, with dashboards tailored for execs, Finance, and HRBPs.
- AI-Powered Analysis: Ask natural-language questions to surface comp gaps, forecast hiring needs, or model reorg scenarios. The system delivers analyst-level insights without requiring a dedicated data team.
At a certain scale, the issue becomes alignment, not data access. If People and Finance are still reconciling different versions of the same numbers every quarter, that’s the bottleneck to fix first.

FAQs
What are HR analytics insights, and why do they matter in 2026?
HR analytics insights are data-driven findings that translate workforce data, compensation, headcount, attrition, and performance into decisions. In 2026, they matter because U.S. companies are managing distributed teams across multiple states, with tighter budgets and faster hiring cycles. Gut-feel decisions on comp and headcount are too expensive to sustain at scale.
Which HR analytics metrics should a CPO track every month?
The six that move the needle most: compa-ratio vs. market benchmark, regrettable attrition rate, internal mobility rate, offer acceptance rate, manager span of control, and headcount plan vs. actual. These six connect directly to retention risk, comp equity, and budget accuracy, the three areas where People leaders have the most business impact.
How do HR analytics insights help reduce employee attrition?
Predictive analytics flags flight risk before an employee resigns — typically through signals like compensation falling below market, tenure hitting a known drop-off window, or manager overspan in a specific team. U.S. companies using predictive attrition models have reduced regrettable turnover by identifying and acting on these patterns 60 to 90 days earlier than reactive reporting allows.
What is the difference between descriptive and predictive HR analytics?
Descriptive analytics tells you what already happened. Predictive analytics tells you what's likely to happen next, which employees are at flight risk, which roles are likely to go vacant, and which comp bands are drifting out of market. Scaling teams need both, but predictive is where the strategic value sits.
How can HR analytics improve compensation planning for U.S. distributed teams?
By replacing static, nationally averaged pay bands with location-specific benchmark data updated in real time. For distributed U.S. teams operating across states like California, New York, and Texas, national averages systematically misrepresent the market. HR analytics tied to geo-adjusted comp data ensures pay bands stay competitive by location, reducing offer declines and closing pay equity gaps before they become a legal or retention risk.
Why are HR and Finance always misaligned on headcount numbers?
Because they're usually tracking different things in different systems. HR tracks approved roles; Finance tracks budgeted headcount. When a role is paused, repurposed, or backfilled ahead of schedule, neither system updates automatically. The fix is a shared platform where headcount requests, approvals, and actuals are visible to both teams in real time, turning the quarterly reconciliation from a negotiation into a routine check-in.
Ready to modernize your workforce and compensation strategy?
See how CandorIQ brings workforce planning and compensation together with AI.