10 Total Rewards Metrics to Fix Compensation Gaps in 2026
See 10 total rewards metrics benchmarks for 2026. Learn how HR and Finance teams prioritize pay, allocate budgets, and fix compensation gaps. Read more.

Compensation planning rarely breaks in spreadsheets. It slows down when teams need to clearly decide who should receive a raise during each cycle.
In 2026, 24% of organizations still report challenges attracting and retaining talent, even with structured reward programs in place. That puts more pressure on getting compensation decisions right during each planning cycle.
Most companies track total rewards metrics, but those metrics often fail at the point of decision. Salary increases get distributed evenly, critical roles are overlooked, and compensation data does not translate into clear actions.
This guide explains how HR and Finance teams can use these metrics to identify pay gaps, prioritize compensation changes, and allocate budgets with precision during each planning cycle.
Key Takeaways
- Total rewards metrics only matter when they directly guide compensation decisions, such as identifying underpaid employees, correcting pay gaps, and prioritizing salary adjustments within fixed budgets
- Pay positioning metrics like compa ratio and salary range penetration are the most reliable indicators for deciding who should receive increases and where pay structures are misaligned
- Budget allocation should be concentrated on high-impact roles and visible pay gaps, not distributed evenly, to prevent wasted spend and repeated attrition-driven hiring costs
- Early signals, such as attrition spikes, offer declines, and high cost per hire, indicate compensation issues before they impact financial performance, allowing proactive correction
- Connecting these metrics to planning workflows enables HR and Finance teams to allocate compensation budgets with control, maintain pay equity, and make consistent, defensible compensation decisions
What Are Total Rewards Metrics?
Total rewards metrics are the key measurements that show you how effective your employee offerings are, beyond just the paycheck.
These metrics show how compensation and benefits spend impact retention, hiring outcomes, and overall workforce costs.
Total rewards include 5 core elements: compensation, benefits, well-being, recognition, and career development.
Total rewards metrics measure:
- Cost efficiency: What you're spending vs. market benchmarks
- Competitive positioning: How your packages compare to competitors
- ROI impact: Whether rewards improve retention, performance, and engagement
- Pay equity: Fairness across teams, roles, and demographics
- Budget allocation: Where your compensation dollars are most effective
For growing companies, these metrics enable structured compensation planning instead of reactive adjustments. Rather than scrambling when top performers leave or discovering pay gaps during audits, you spot trends early and make adjustments before issues become costly.
The result? You’re measuring outcomes, not just tracking expenses.
However, without tracking these metrics, you're managing compensation with guesswork. And guesswork is expensive.
Metrics become more useful when they sit inside a clear planning framework, as shown in how to build and implement an effective total rewards strategy?

10 Most Important Total Rewards Metrics to Track For HR Success in 2026

Each metric should help your team make a specific compensation decision. Instead of treating them as reporting indicators, use them to set pay baselines, direct budget, and validate whether compensation spend is solving the right problem.
1. Turnover Rate
Use turnover data to identify where compensation issues are already creating cost pressure.
How HR and finance teams should act:
- Compare turnover by department, tenure band, and role family, not only at the company level.
- Flag roles with repeated exits before approving more hiring budget for backfills.
- Review whether early attrition is tied to weak offer competitiveness or poor salary progression after joining.
Example:
If your customer success team shows 18% voluntary turnover while the company average is 10%, and most exits happen within 12 months, that points to pay positioning issues. Instead of increasing recruitment spend, you may decide to raise salary bands for that role and correct pay for current employees to reduce repeat backfill costs.
2. Compa Ratio
Use the compa ratio to decide where salary corrections should happen before merit increases are spread across the business.
How HR and finance teams should act:
- Review employees below the midpoint by function, level, and performance group.
- Separate market corrections from standard merit increases.
- Prioritize underpaid critical roles before applying broad percentage-based increments.
Example:
If several high-performing finance analysts sit at a 0.82 compa ratio while new hires are joining closer to the midpoint, your team may approve targeted market adjustments first. This prevents merit budgets from being diluted without fixing the actual pay gap.
3. Salary Range Penetration
Use range penetration to assess whether employees are progressing properly within pay bands or are stuck.
How HR and finance teams should act:
- Identify employees near the top of the band without promotion readiness.
- Flag high performers with low penetration as possible under-leveling cases.
- Review whether current bands are too narrow to support multi-year growth.
Example:
If a senior payroll manager has delivered strong results for two cycles but remains low in the band, finance may approve a progression increase or review job level placement. If another employee is already at 95% of the band with no scope change, that may signal the need for a promotion decision rather than another standard increment.
4. Salary Budget Allocation
Use budget allocation data to decide where limited increase budgets will create the most retention or performance value.
How HR and finance teams should act:
- Break the salary budget into buckets such as market corrections, promotions, retention cases, and general merit.
- Avoid flat increases across all teams when risks are concentrated in specific roles.
- Tie budget decisions to business-critical roles, replacement cost, and revenue impact.
Example:
If your total salary budget increase is capped at 3.4%, finance may decide not to spread it evenly. Instead, you could direct more of the budget to engineering, revenue operations, and finance control roles where replacement costs are high and retention risk is rising.
5. Cost Per Hire
Use cost per hire to test whether compensation is strong enough to attract talent efficiently.
How HR and finance teams should act:
- Compare hiring cost with offer acceptance rate and time to fill.
- Review whether expensive hiring markets are being made worse by below-market salary offers.
- Increase starting salary selectively where repeated hiring friction is driving more agency or sourcing spend.
Example:
If it costs far more than expected to fill a data analyst role, and shortlisted candidates keep rejecting offers, finance may approve a higher starting salary band instead of continuing to spend on external recruiters and prolonged vacancies.
6. Benefits Cost Per Employee
Use the benefits cost per employee to understand how rising benefits spend affects salary flexibility.
How HR and finance teams should act:
- Track benefits growth alongside total compensation budgets, not in isolation.
- Review whether increases in healthcare or insurance spend are reducing room for salary actions.
- Model total cost before approving salary increases, especially in high-cost employee groups.
Example:
If benefits costs rise sharply for a particular employee segment, finance may need to adjust merit pools or rebalance the rewards mix. This helps avoid approving salary increases that look affordable in base pay terms but exceed total compensation targets once benefits are included.
7. Benefits Utilization Rate
Use utilization data to shift spend away from low-value programs and into rewards employees actually notice.
How HR and finance teams should act:
- Review high-cost benefits with consistently low usage.
- Segment usage by workforce group to see whether one plan is overspending for limited value.
- Reallocate part of the budget into cash compensation, allowances, or better-used benefits where appropriate.
Example:
If a wellness benefit has a high annual cost but very low participation, finance may recommend reducing that spend and redirecting part of the amount into transport allowances, salary adjustments, or learning support that employees value more directly.
8. Internal Mobility Rate
Use internal mobility data to decide whether compensation structures support career movement or force external hiring.
How HR and finance teams should act:
- Compare promotion and internal transfer rates with external hiring volume.
- Review whether employees moving into larger roles are receiving meaningful pay movement.
- Build salary progression rules that support internal moves before defaulting to outside hiring.
Example:
If your company keeps hiring externally for team lead roles while strong internal candidates remain in place, finance should test whether internal pay movement is too small to support promotions. Raising internal progression ranges may reduce hiring costs and improve retention of top performers.
9. Pay Transparency Readiness
Use pay transparency readiness to reduce inconsistent compensation decisions across managers and departments.
How HR and finance teams should act:
- Check whether managers can explain pay decisions using clear salary ranges and progression rules.
- Standardize how exceptions, promotions, and market corrections are approved.
- Strengthen communication before changing pay structures so managers can apply them consistently.
Example:
If two employees in similar roles receive different salary treatment without a clear explanation, finance may introduce structured band guidance and manager approval rules. This improves trust and reduces the risk of reactive off-cycle corrections later.
10. AI Talent Pay Premium
Use AI pay premium data to decide where premium pay is justified and where upskilling is more cost-effective.
How HR and finance teams should act:
- Reserve premium pay for roles where AI capability directly affects business output or speed.
- Compare the cost of hiring external AI talent against reskilling current employees.
- Review the internal pay balance before creating new premium bands.
Example:
If hiring an AI product specialist requires a 12% premium over comparable digital roles, finance should test whether that premium supports a real business need. In some cases, the better decision may be to pay a premium for one specialist role while funding targeted upskilling for adjacent team members instead of repricing an entire function.
Each metric provides a specific signal tied to pay structure, cost control, or workforce movement. Used together, they help teams prioritize compensation changes instead of reacting to isolated data points.
Why Total Rewards Metrics Matter for Compensation Planning
These metrics give HR and finance teams a clear view of how pay decisions play out in the real world. Instead of relying on assumptions, teams can see where pay is misaligned, where budgets are drifting, and where employees may be at risk of leaving.
Key ways metrics shape compensation planning decisions:
- Spot Pay Gaps Early: Compa ratio (employee pay vs role midpoint) shows who may be underpaid or overpaid, helping adjust salaries before issues surface.
- Control Workforce Spend: Compensation cost as a share of revenue helps teams track if hiring and pay decisions are staying within planned budgets.
- Check Fairness Across Teams: Comparing pay across roles and groups helps identify patterns that may need closer review and correction.
- Improve Benefit Spend Decisions: Benefit usage data shows which programs employees actually value, guiding smarter budget allocation.
- Maintain Salary Band Discipline: Tracking employees outside pay ranges highlights where compensation structures may need updates.
Used consistently, these metrics help teams make clearer, more confident compensation decisions while keeping pay structures aligned with business goals and workforce needs.
Modern compensation planning depends more on data and automation, which is why the AI-powered evolution of total rewards.
Key Tips to Keep These Metrics Unbiased and Honest
These measures only work when the underlying data reflects real pay conditions. That means validating inputs, structuring comparisons correctly, and isolating true pay drivers before using them in compensation planning.
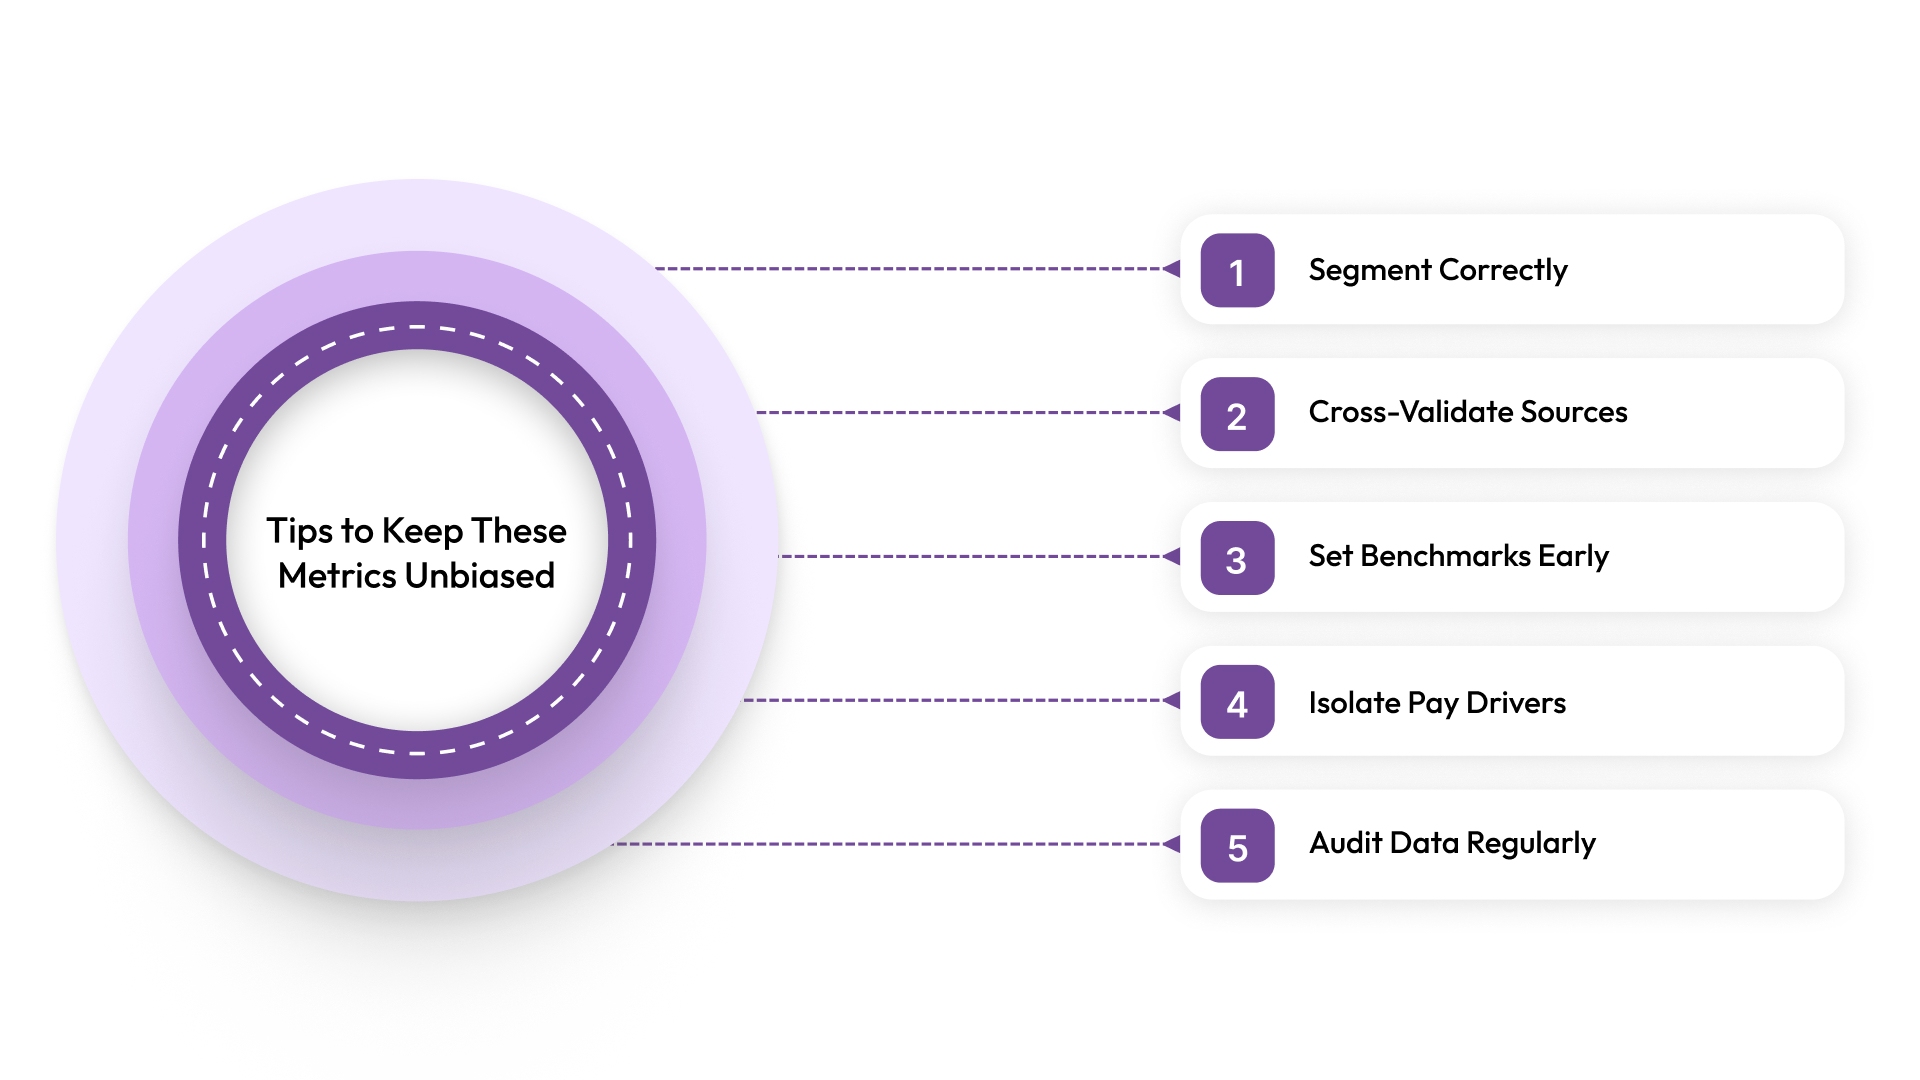
Practices that improve reliability during planning cycles:
- Segment Correctly: Compare employees by role, level, and location to avoid distorted insights
- Cross-Validate Sources: Combine HRIS, payroll, and performance data for accuracy
- Set Benchmarks Early: Define acceptable ranges before analyzing metrics
- Isolate Pay Drivers: Use regression analysis to separate valid pay factors
- Audit Data Regularly: Standardize titles and clean incomplete or duplicate records
Clean, structured data ensures compensation decisions are consistent and reliable.
Keep your rewards strategy relevant across age groups and career stages by focusing on creating a total rewards strategy for a multigenerational workforce

Common Mistakes When Tracking Total Rewards Metrics
Most teams track compensation and rewards data, but many fail to turn it into reliable input for planning. The issue is usually not a lack of information, but how data is selected, connected, and interpreted across systems, which can lead to misaligned pay decisions and budget inefficiencies.
Frequent mistakes that reduce reliability in compensation planning:
Poor metric design leads to poor compensation decisions. Fixing data structure, coverage, and interpretation ensures that these metrics support accurate, timely, and scalable planning outcomes.
Make sure your metrics capture the full value of employee rewards by first understanding what does total rewards actually mean and what does it include?
How CandorIQ Helps You Turn Metrics Into Planning Decisions
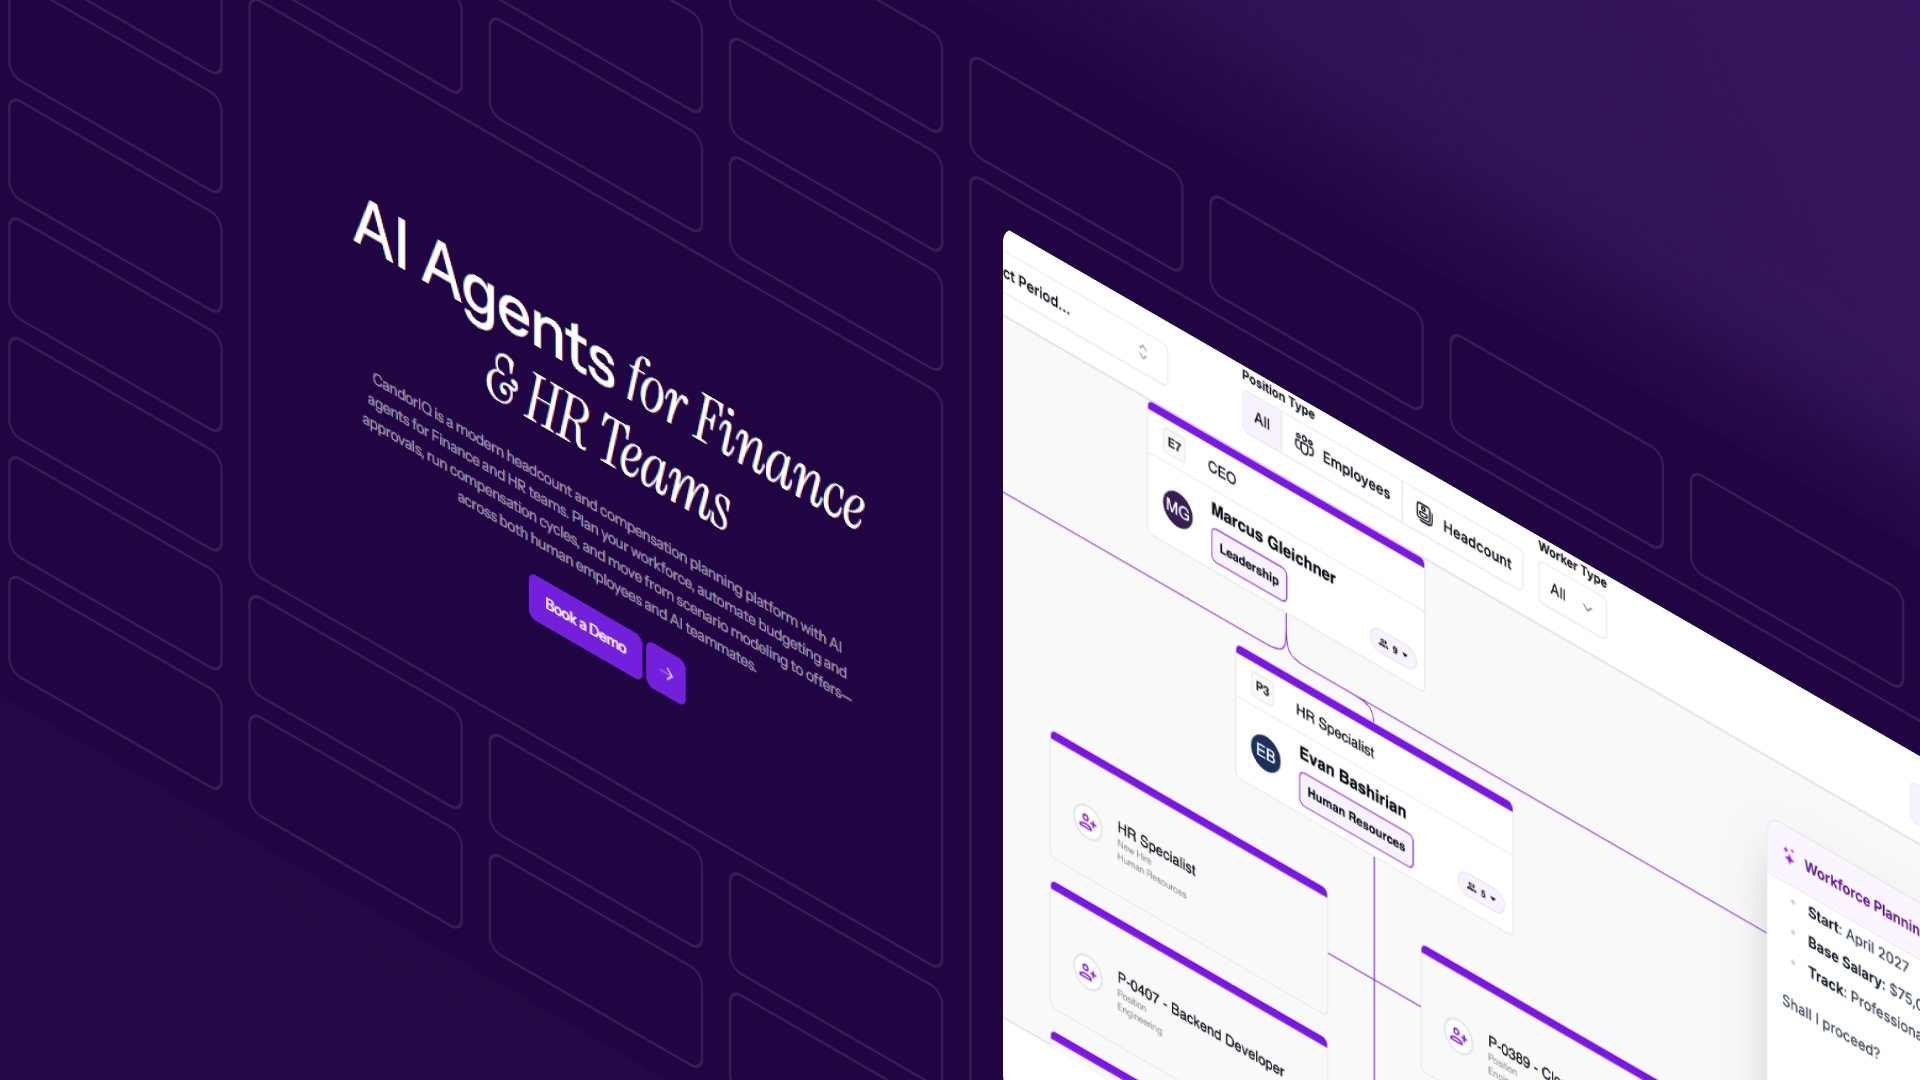
CandorIQ is a compensation and headcount planning platform built for finance and HR teams who need to move faster without losing control. It replaces scattered spreadsheets with a single system where total reward program metrics directly inform salary decisions, hiring plans, and budget approvals.
Instead of tracking metrics in isolation, CandorIQ connects them to real planning workflows through products designed for compensation and workforce decisions:
- Compensation & Payband Builder: Build salary bands, map employees to levels, and compare pay against market benchmarks in one place. This helps teams catch pay gaps and role-level inconsistencies early, so compensation decisions stay fair, structured, and easier to defend.
- Compensation Cycle: Run merit reviews, salary adjustments, reporting, and spend tracking in one workflow instead of across disconnected files. This helps teams move faster, stay within budget, and make more consistent reward decisions.
- Employee Total Rewards: Give employees clear visibility into salary, equity, benefits, and career expectations. This improves transparency, supports better compensation conversations, and helps strengthen trust and retention.
- Candidate Offers: Create and approve offers using live pay band data, approved budgets, and structured workflows. This shortens approval time, improves offer consistency, and helps hiring teams move faster without creating pay misalignment.
- Headcount Scenario Planning: Model hiring plans against budgets, growth targets, and org changes before decisions are made. This helps leaders understand cost impact early, avoid overhiring, and plan workforce growth with more confidence.
- Headcount Requests & Approvals: Replace scattered approval chains with one workflow that connects hiring requests to budget, role context, and approval status. This reduces bottlenecks, improves decision control, and keeps hiring aligned with business priorities.
.png)
FAQs About Total Reward Metrics
1. How often should total metrics be reviewed?
Review core metrics like turnover rates monthly and conduct comprehensive audits quarterly. Weekly dashboards for fast-growing companies help monitor recruitment costs and offer acceptance rates.
2. How do you calculate the cost of total rewards per employee?
Add direct compensation and employer-paid benefits, then divide by total headcount. Typically, total rewards cost 1.25x to 1.4x base salary.
3. What's a good turnover rate for my industry?
Industry turnover varies, but more important is tracking your own trends. Increasing turnover signals problems even if you're below industry benchmarks.
4. What are the 5 components of total rewards?
Total rewards typically include base compensation, variable pay, benefits, well-being programs, and career development. Together, they define the full value employees receive beyond salary and shape how compensation is perceived internally.
5. What are the pillars of total rewards?
The main pillars are compensation, benefits, wellbeing, development, and recognition. These pillars guide how organizations structure rewards to support workforce needs and maintain consistency in compensation decisions.
Ready to modernize your workforce and compensation strategy?
See how CandorIQ brings workforce planning and compensation together with AI.