Forecast Accuracy When Compensation Is Tied to Financial Results: 2026 Guide
Learn proven strategies for forecast accuracy when compensation is tied to financial results. Boost forecast accuracy and prevent comp leakage in 2026.

Sales compensation and forecast accuracy are more connected than most companies admit. When incentives are tied to revenue outcomes, the way those outcomes are reported often shifts. Reps may overstate pipeline confidence to unlock accelerators or delay deals to protect future quotas. The result is forecast accuracy declines, and compensation plans start rewarding the wrong behaviors.
The data reflects this tension. In 2025, only 7% of sales organizations achieve 90% or higher forecast accuracy, and in environments where variable pay is tightly tied to revenue, that number drops even further. The issue isn’t just forecasting discipline; it’s how incentives are structured.
This blog explores how compensation tied to financial results shapes forecast accuracy and how to design plans where incentives and accuracy reinforce each other, not conflict.
Key Takeaways
- When bonuses and commission depend on revenue numbers, reps have a built-in reason to shape those numbers, either by inflating pipeline confidence or deflating it to protect future quotas. Spotting these patterns early is half the battle.
- Forecast accuracy isn't just a data problem. It's a trust problem. Fix the incentives first, then the data follows.
- You can make forecast accuracy a measurable, scoreable part of your comp plan, and it works.
- CandorIQ's AI Agent can flag chronic over-promisers and sandbaggers before they quietly skew your quarterly results.
- Companies that design comp plans with forecast reliability in mind see less comp leakage, better budget planning, and a smaller gap between what was projected and what actually closed.

How Compensation Distorts Forecast Accuracy
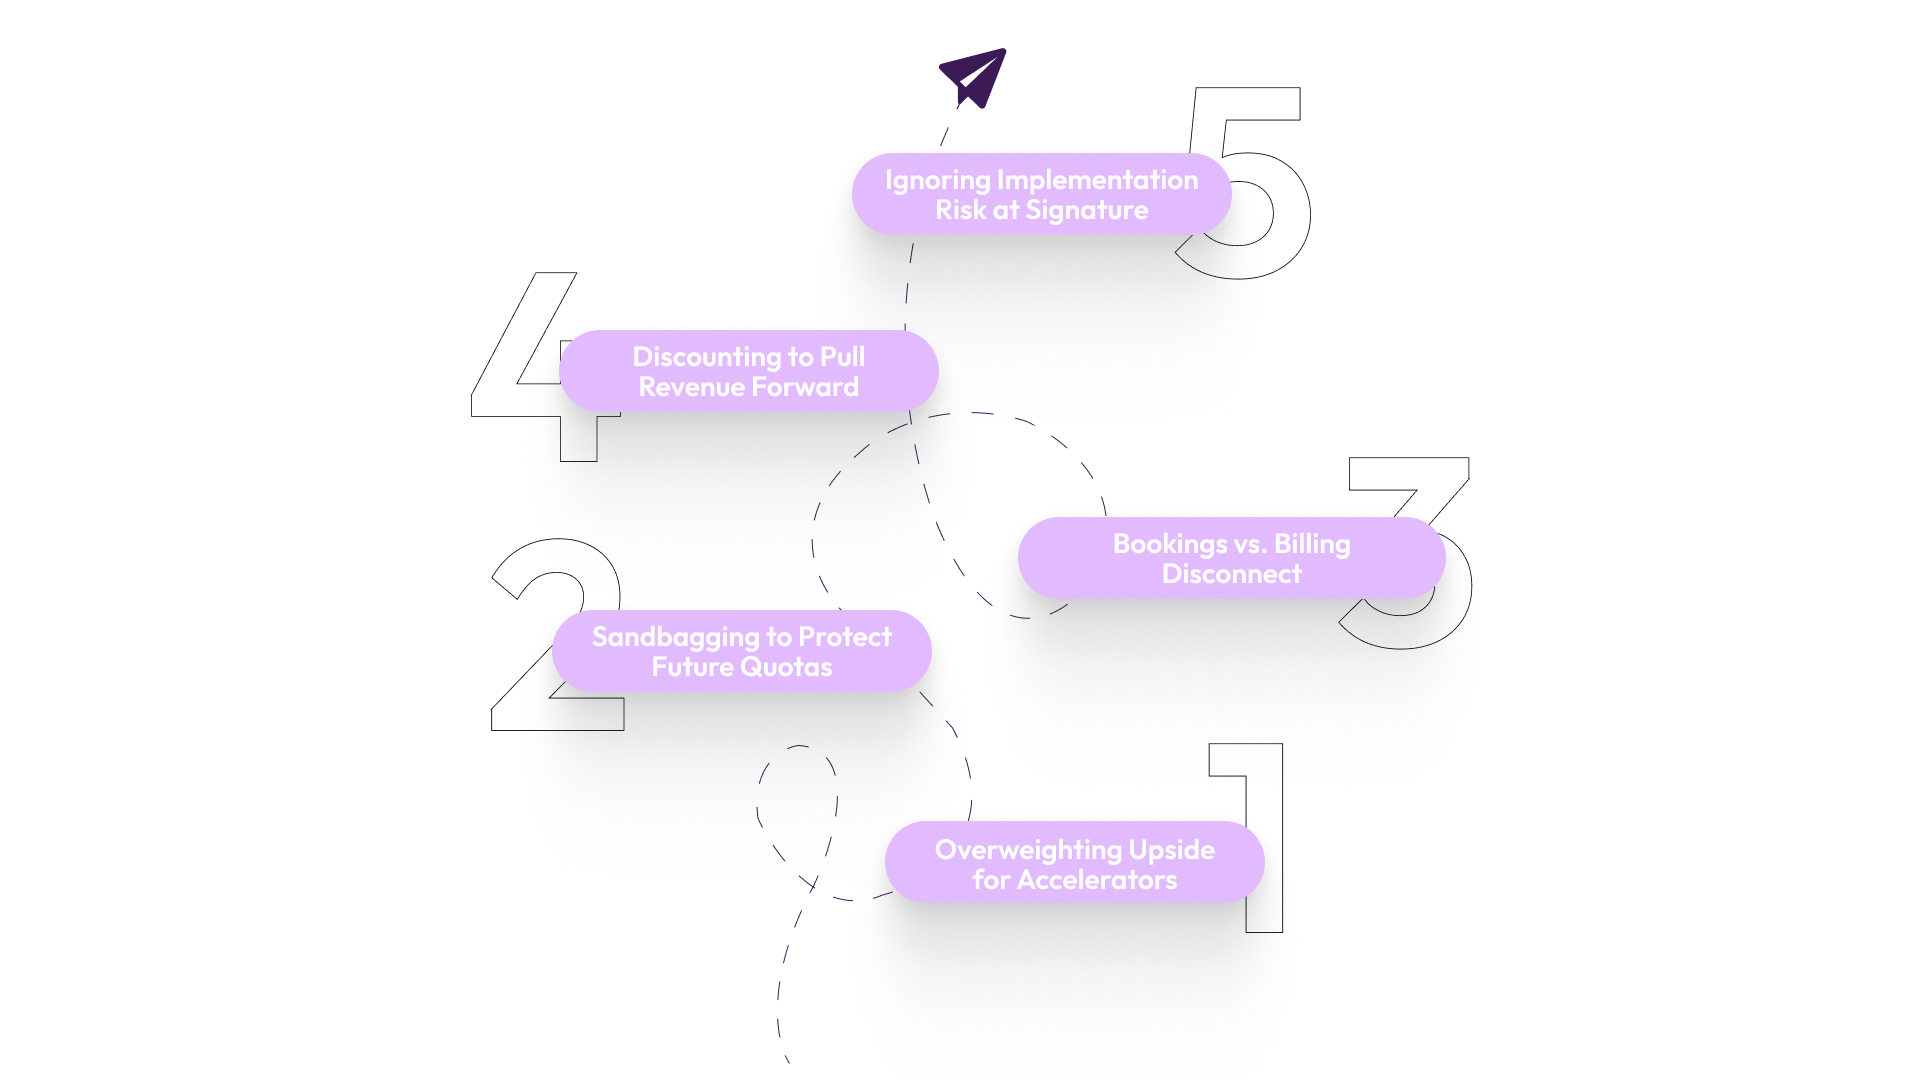
It's easy to say "reps game the system." But that framing misses something important. Reps usually aren't gaming anything. They're responding rationally to the incentives you built. Here are the five most common patterns.
1. Inflating Forecasts to Hit Targets
When accelerators kick in above quota, every deal starts looking like a sure thing. Reps push deals into "commit" before buyers are ready. They ignore red flags. The forecast inflates, and the miss at quarter close was predictable from week two.
2. Sandbagging to Lower Next Quarter's Quota
Hit quota in October? Great. Now you have a problem. Closing more deals this quarter likely means a higher quota next quarter. So reps slow-walk proposals, re-stage deals, or hold conversations. The forecast looks thin, not because the pipeline is, but because the rep is protecting future earnings.
3. The 90-Day Slip: Booking vs. Billing Disconnect
A signed contract is not the same as recognized revenue. When comp is paid on booking, reps chase signatures, even on deals that aren't fully scoped or internally aligned. The forecast shows bookings. Finance sees billing delays. The gap between those two numbers is where trust breaks down.
4. Discretionary Discounting to Pull Revenue Forward
It's the last week of the quarter. A rep is at 85% of quota. They offer a 20% discount to get a deal signed now. Booking hits. Commission gets paid. But the margin wasn't in the plan, and Finance finds out weeks later. The forecast showed the revenue, not the erosion underneath it.
5. Ignoring Implementation Risk to Secure a Signing Bonus
Complex deals often come with complex implementations. When comp is paid at signature, the rep's job is done. Whether the customer actually adopts the product, or churns in 90 days, it lands on customer success and finance. The risk was never visible in the original forecast.
Here's what all five patterns have in common. They're all rational responses to a comp plan that didn't account for them. That brings us to the real question: what does accurate forecasting actually need to work?
What Forecast Accuracy Actually Requires
Forecast accuracy is often framed as a data problem. Get cleaner CRM inputs. Enforce stage hygiene. Run better pipeline reviews. Those things matter, but they're downstream of a more fundamental issue.
Forecasting breaks down when people don't feel safe being honest. A rep who flags a deal as risky shouldn't feel like they're putting their commission at risk by doing it or a manager who pushes back on inflated pipeline shouldn't feel like they're killing team morale.
For that to work, you need a few things in place:
- Stage definitions with clear, objective exit criteria.
- Historical win rate and slippage data, by deal type and rep.
- A culture where forecast accuracy is tracked and matters, not just attainment.
- A comp structure that doesn't punish honest reporting.
None of this is complicated in theory. The hard part is comp plan design, specifically, building a plan that rewards precision without killing motivation. That's what the next section is about.
Also Read: Ultimate HR Guide to Fair & Transparent Financial Compensation

7 Ways to Improve Forecast Accuracy When Compensation Is Tied to Financial Results
Fixing forecast accuracy is several strings, pulled together. Some are about process. Some are about culture. Some are about how you structure reviews and pipeline calls. None of them requires blowing up your comp plan first. Start here.
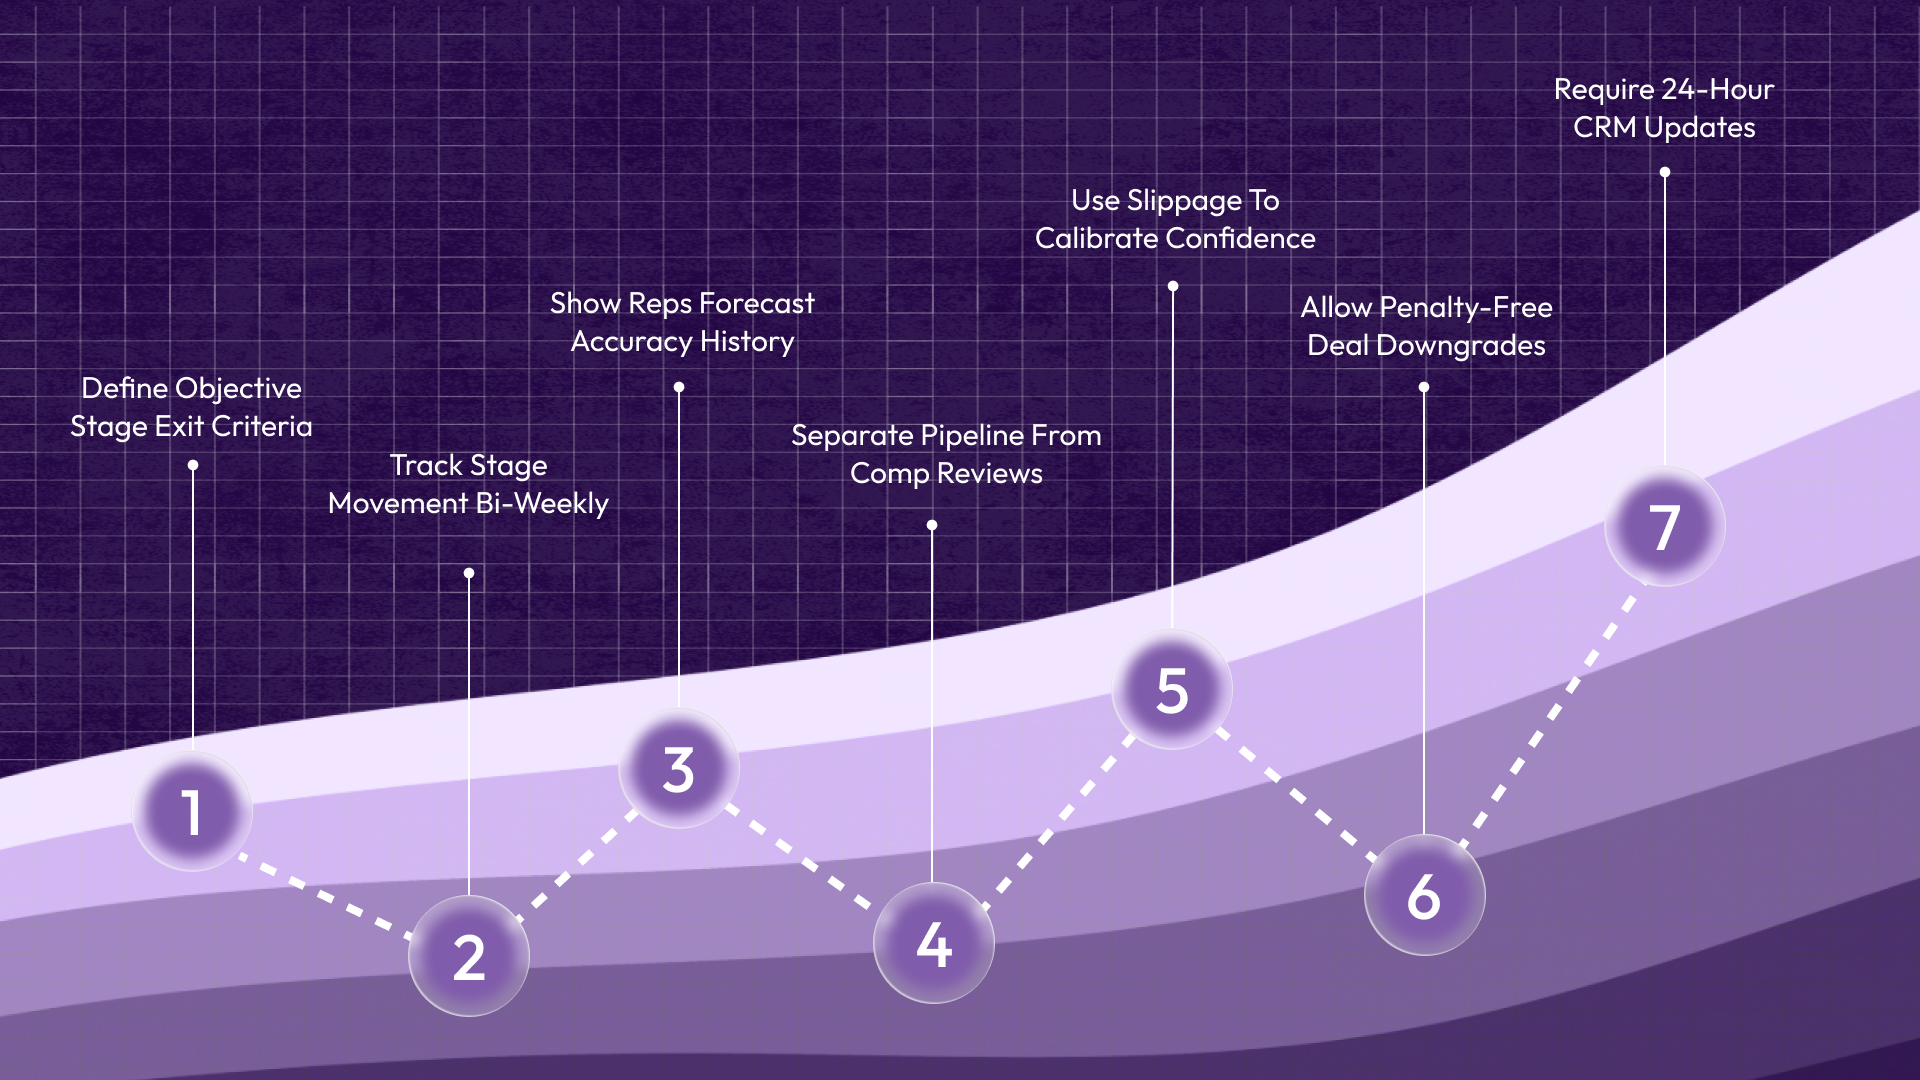
- Define stage exit criteria objectively: Stages should advance based on buyer actions, signed NDA, confirmed budget, and an executive sponsor identified, not on how a rep feels about a deal. Subjective staging is where forecast distortion begins.
- Run bi-weekly forecast reviews that track changes: A deal that jumps from stage 2 to "commit" in one week is a red flag. Reviewing movement over time catches sandbagging and over-calling before they compound.
- Give reps visibility into their own forecast accuracy history: Most reps don't realize how often their commitments miss. Show them their rolling accuracy score, the same way you show quota attainment. Awareness shifts behavior before consequences do.
- Separate pipeline review from comp conversations: When forecast calls double as commission check-ins, reps shade their answers. Keep those conversations in different rooms so reps can be honest about deal risk without feeling like they're negotiating their own paycheck.
- Use historical slippage data to calibrate confidence categories: If deals in your "best case" category close at 35% historically, that category needs a different label or a different weight in your forecast model. Anchor your forecast to what's actually happened, not what you hope will.
- Create a no-penalty zone for downgrading deals: Reps hold deals in inflated stages because downgrading feels like admitting failure. Make it explicit. Moving a deal back a stage is good forecasting, not bad selling. Recognize reps who do it accurately.
- Require CRM updates within 24 hours of key buyer interactions: Stale pipeline data is forecast noise. When activity logging is real-time, forecast calls reflect reality, not what was true three weeks ago.
These seven practices tighten your forecast from the operational side. But the real leverage point, the one that directly changes how reps report, is compensation design. That's where we go next.
Also Read: A Practical Guide to Headcount Forecasting for High-Growth Teams
How to Make Forecast Accuracy Part of Sales Compensation
Most comp plans reward one thing that is closing deals. But if accuracy never shows up in the plan, reps have no financial reason to care about it. Here's how to change that without rebuilding your comp structure from scratch.
1. Shift from "Deal Commitment" to "Forecast Precision" KPIs
Stop asking reps just to commit to deals. Start tracking how often their committed deals actually close, and at what value. That ratio, measured over rolling quarters, becomes a scoreable metric. Reps with consistently high precision get first consideration for SPIFs, stretch targets, and advancement.
2. Implement Forecast Accuracy Gates for Accelerators and SPIFs
Before a rep qualifies for accelerator payouts, require that their rolling forecast accuracy meets a defined threshold, say, within ±10% of actual results over the prior two quarters. This creates a direct link. Want access to upside comp, then be an honest forecaster. Reps who consistently over-call or sandbag don't qualify for the top payout tiers.
3. Design a "Risk-Adjusted" Commission Payout Schedule
Instead of paying full commission at signature, split payouts across the deal lifecycle. For example, a portion at signing, a portion at the implementation milestone, a portion at first billing, or renewal. This ties comp to outcomes, not just activity. It reduces the incentive to close deals before they're ready. And it quickly surfaces the deals where the post-sale reality doesn't match the pre-sale forecast.
4. Reward Sales Managers Based on Team Forecast Reliability
Managers are your most powerful lever here. If their comp is tied purely to team attainment, they'll push aggressive pipeline calls, even if the forecast was inflated all quarter to get there. Add a team forecast accuracy metric to manager comp, and you shift the incentive toward coaching honest reporting, not just pushing deals.
5. Use Clawback Clauses Tied to Material Variance
Clawbacks, recouping commissions if a deal falls apart within a defined period, are legal in most U.S. states. But enforcement varies. California has specific restrictions. There clawbacks must be explicitly written into the comp agreement and can't reduce pay below minimum wage for hours worked. Any clawback clause needs legal review before it goes live.
When they're designed correctly, clawbacks change the calculation for reps. Closing a shaky deal isn't free anymore. A reversal could cost them money they've already received.
Once your compensation plan is designed to reward accuracy, you need a way to measure whether it's actually working. That means tracking the right metrics.
Also Read: Creating an Effective Employee Compensation Plan
4 Critical Metrics for Measuring Forecast Accuracy in Variable Comp Plans
A better comp structure only works if you're tracking the right things. Here are the four metrics that tell you whether your forecast accuracy is improving or just looks like it is.
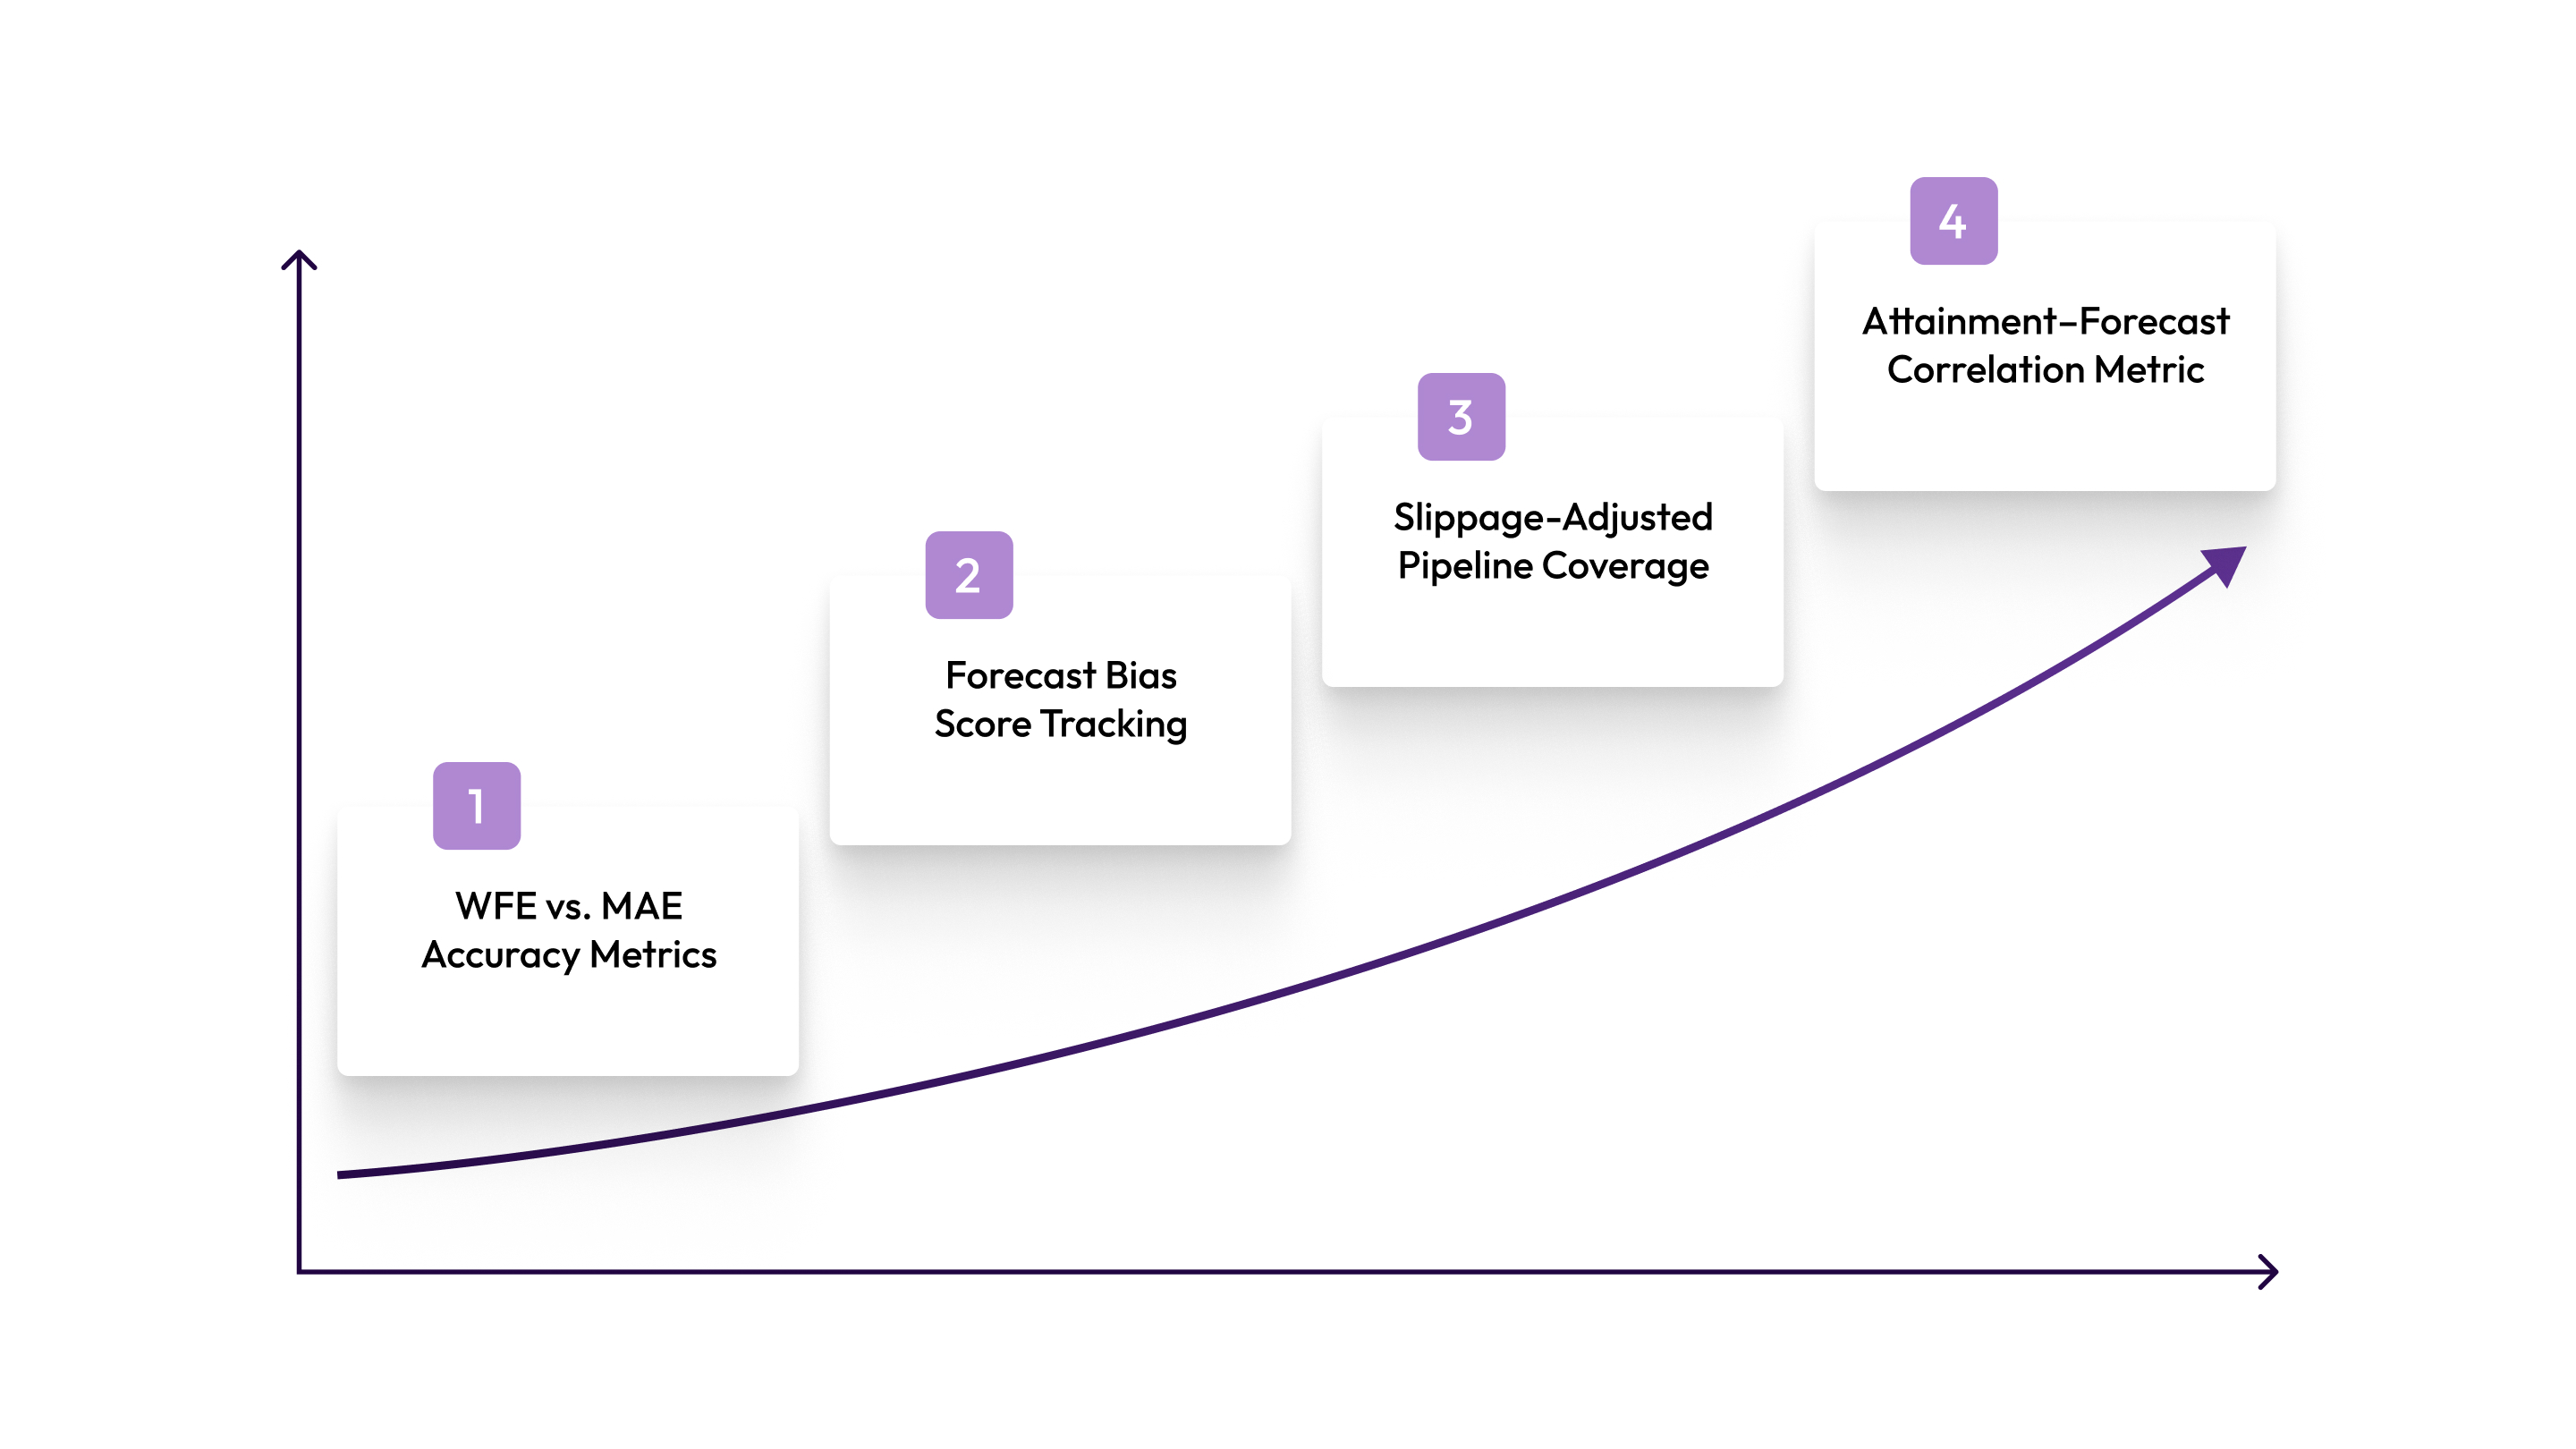
1. Weighted Forecast Error (WFE) vs. Simple Mean Absolute Error (MAE)
Mean Absolute Error gives you the average gap between forecasted and actual revenue. Simple, useful, but incomplete. Weighted Forecast Error goes further. It accounts for deal size and timing, putting more weight on large deals that were consistently misforecast.
For comp purposes, WFE gives you a more honest read on how a rep's bias is affecting your planning.
2. Bias Score: Identifying Chronic Over-Promisers and Sandbaggers
Bias score tracks the direction of a rep's forecast errors, not just the size. A rep who over-calls by 15%-20% every quarter has a clear pattern, even if their average accuracy number looks fine.
Both chronic over-promisers and chronic sandbaggers distort your planning in different ways. Both should have consequences in how comp is structured for them.
1. Pipeline Coverage Adjusted for Historical Slippage Rate
4x pipeline coverage sounds healthy. But if 40% of deals historically slip each quarter, your real coverage is much lower. Adjusting for slippage gives Finance and RevOps a more accurate number to plan against, and helps you set quota and accelerator thresholds that reflect reality, not wishful thinking.
2. Attainment vs. Forecast Correlation: The True North Metric for RevOps
This is the one that tells you if everything else is working. If a rep forecasts $800K at the start of the quarter and closes $790K, that's high correlation. If they're consistently calling $1.2M and closing $800K, or sandbagging at $600K and closing $950K, the comp plan is producing predictable distortion. Track this at the rep, manager, and team level. Review it quarterly to keep it in alignment.
Your forecast accuracy doesn't fail because of bad intentions. It fails because the systems that support compensation and headcount planning are disconnected. This is where CandorIQ comes in.
How CandorIQ Brings Forecast Accuracy Into Compensation Planning
When your CRM, compensation structure, headcount plan, and finance team don't integrate with each other, you can't see the distortions until it's too late. The quarter closes, the reconciliation happens, and everyone's surprised, again.

That's the gap CandorIQ was built to close. CandorIQ is a unified compensation and headcount planning platform that brings pay structures, comp cycles, and workforce planning into one place, so your HR, Finance, and Sales leadership can all work from the same numbers.
Our key capabilities that support forecast accuracy include:
- Headcount Scenario Planning: Model future org charts and view financial implications in real time. Toggle multiple hiring scenarios and compare against budget thresholds to prevent overspending before it happens.
- Compensation Cycle Management: Automate merit and bonus reviews with built-in approval logic. Track budgets and raises by department, giving leadership visibility into how compensation decisions impact headcount and forecasted burn.
- Real-Time Pay Band and Geo-Adjustment Tools: Define pay bands by level, location, and department using benchmark datasets. Visualize pay distribution across your workforce and apply location-based adjustments consistently.
- Workforce Analytics Dashboards: Track open roles, filled seats, attrition, and promotion rates in one view. Align actuals versus plan on headcount and compensation, eliminating Finance/HR misalignment.
- AI-Powered Compensation Insights: Receive comp recommendations based on historical benchmarks and peer data. Ask natural language questions to analyze gaps or model impact without hunting through spreadsheets.
Forecast accuracy improves when the people making the plan and the people paying the commissions share the same numbers. CandorIQ provides that shared foundation.
.png)
FAQ
How do you measure forecast accuracy in a sales compensation context?
Calculate the variance between forecasted revenue and actual revenue for a given period, then segment by rep, team, and deal stage. Top quartile B2B organizations achieve forecast variance of ±5-10%, while median performers are at ±15-25%. Track Weighted Forecast Error for financial impact and Bias Score to identify systematic over- or under-forecasting.
What's the difference between forecast accuracy and quota attainment?
Forecast accuracy measures how close your prediction was to the actual result. Quota attainment measures the percentage of the assigned quota a rep achieved. A rep can hit quota but still have poor forecast accuracy if they consistently sandbag or over-commit. The two metrics answer different questions.
Q: What's the most common way reps skew forecasts when their comp is on the line?
Sandbagging is the most common. Reps underreport pipeline strength to keep next quarter's quota manageable. Right behind it is over-calling, where reps inflate deal confidence to chase accelerators. Both are rational responses to how the comp plan is built. Neither is a character problem.
Q: Are clawback clauses legal in U.S. sales compensation agreements?
In most states, yes, but the rules vary. California is the most restrictive: clawbacks must be written explicitly into the agreement and can't push pay below minimum wage. Outside California, most states allow them when they're clearly defined upfront. Always get legal counsel involved before you implement one.
Should you claw back commissions if a deal cancels?
Clawback provisions are enforceable in the U.S. if clearly drafted, reasonable, and compliant with state law. They should be tied to objective triggers like customer cancellation within a defined period. Proportionality matters. Clawing back the full commission on a deal that partially delivered may face legal challenge. Consult employment counsel before implementing.
How often should you review forecast accuracy metrics?
Weekly for pipeline health, monthly for rep-level trends, quarterly for compensation plan effectiveness. Organizations that recalibrate forecast models only monthly or less frequently struggle with data consistency. Frequent review catches issues before they compound.
What's the biggest driver of forecast inaccuracy when comp is involved?
Rep-submitted forecasts, simply asking reps what they'll close, are the least accurate method, with a variance of ±25-35%. The combination of sandbagging, happy ears, and stage confusion corrupts the data before any analytics touch it. This is why shifting from "deal commitment" to "forecast precision" KPIs is essential.
Ready to modernize your workforce and compensation strategy?
See how CandorIQ brings workforce planning and compensation together with AI.