What Is Compensation Analysis? A Proven Guide for Scaling Teams in 2026
Learn what compensation analysis is, why it matters, and how to run one at scale. The complete guide for CPOs and HR leaders in 2026.

Do you know whether your pay structure is actually keeping your best people? According to a 2025 Paychex survey, 69% of U.S. employees say they are actively job searching, and compensation dissatisfaction is the leading reason.
For HR and finance leaders at scaling companies, this is not a background concern. It is a live threat to retention, offer acceptance, and budget credibility. Most teams wait until attrition spikes or a compensation cycle rolls around before they look at the data. By then, they are already behind.
This guide walks you through everything you need to run a structured, effective compensation analysis in 2026.
Key Takeaways
- Compensation analysis is a structured review of pay, benefits, and equity across roles, levels, and geographies to ensure your comp strategy is fair and competitive.
- In 2026, pay transparency laws across multiple U.S. states will make regular compensation analysis a legal and operational necessity, not just a best practice.
- Distributed teams require geo-differentiated benchmarking. A flat national benchmark leaves real pay gaps unaddressed and creates internal equity problems.
- The most common mistakes, like single-source benchmarking, annual-only cadences, and running it without CFO alignment, cost companies talent they cannot afford to lose.
- Platforms like CandorIQ bring compensation analysis, pay band management, and headcount planning into one system, replacing disconnected spreadsheets with real-time data.
What Is Compensation Analysis?
Compensation analysis is the structured process of evaluating how your organization pays its employees, relative to the market, to each other, and to your own pay philosophy.
Done well, it tells you who is underpaid, where equity gaps exist, and whether your pay structure can support the growth plan.
.png)
What Does a Full Compensation Analysis Actually Cover?
A compensation analysis is not limited to salaries. For scaling U.S. companies, especially those managing distributed, remote teams, the scope needs to be wide enough to surface every variable that affects how fairly and competitively you pay people.
- Base salary: Current pay compared to internal bands and market benchmarks by role and level.
- Short-term incentives: Bonuses, commissions, and performance pay. Are they structured fairly?
- Equity and stock: RSUs, options, and vesting schedules, especially relevant at growth-stage companies.
- Benefits: Health insurance, retirement match, PTO. These affect the total compensation value significantly.
- Geographic differentials: Pay adjustments for employees across different U.S. cities and states.
- Demographics: Pay broken down by gender, race, tenure, and other factors to surface equity gaps.
Are Compensation Analysis and Salary Benchmarking the Same?
These two terms are often used interchangeably, but they are not the same. Salary benchmarking answers the external question of what the market pays. Compensation analysis is the full picture. Internal equity, pay equity across demographics, total rewards value, and alignment with business goals.
Here's how they actually differ:
Benchmarking without the broader analysis is a bit like checking one tire and calling the car roadworthy.
Now that you know what compensation accounting covers, it helps to understand that 'compensation analysis' is not one single exercise. Depending on your business goal, you may need one type or a combination of several.
5 Types of Compensation Analysis Explained
Not every analysis looks the same. Depending on your goals, compliance, retention, hiring, or scale, you may run one or several of these types. Here is what each one actually does and when you need it.
- Internal Equity Analysis: This review answers: Are employees doing similar work paid similarly? It examines pay across roles within the same organization. A common red flag is when a new hire earns more than a tenured employee in the same role, a pattern that quietly fuels attrition. For scaling teams adding headcount quickly, internal equity drifts fast.
- External Market Benchmarking: This compares your pay to what competitors are offering for equivalent roles. U.S.-based sources like Radford (Aon), Mercer, Levels.fyi, and BLS Occupational Employment Statistics give you grounded data. The 'market' is not one number. It varies by industry, geography, company size, and stage.
- Pay Equity Analysis: It examines whether pay gaps exist across gender, race, age, or other protected characteristics. In the U.S., Title VII and the Equal Pay Act set the baseline, but many states go further. In several U.S. states, running a pay equity analysis is becoming a compliance expectation.
- Total Compensation Analysis: This evaluates the full value of what employees receive, not just base salary. A company paying below market on salary but offering generous equity, strong health benefits, and flexible PTO may still be highly competitive overall.
- Role-Level and Job Grade Analysis: This ensures your salary bands actually match your leveling framework. At fast-growing companies, job grades often drift. A 'Senior Engineer' hired two years ago may be doing work that now maps to a Staff level. Without regular review, your pay bands stop reflecting reality.
However, the harder question most leadership teams avoid is what is the actual cost of not doing this? The answer, especially heading into 2026, is sharper than most companies expect.
5 Reasons You Cannot Avoid Your Compensation Analysis Any Longer in 2026
The companies putting off their analysis are not saving time. They are accumulating risk. Here is what is making 2026 a pivotal year for U.S. HR and finance leaders.
1. Pay Transparency Laws Are Forcing the Issue
Colorado, California, New York, and Illinois now require employers to post salary ranges in job listings. If you post a remote role and a current employee in one of those states sees a range that doesn't match their pay, you have an immediate credibility problem.
2. Distributed Teams Created a Multi-Geo Pay Crisis
Remote work expanded where companies hire. Most pay structures were not designed for that. If your team spans San Francisco, Austin, Denver, and Raleigh, your 2019 pay bands almost certainly do not reflect today's reality.
Without geo-adjusted benchmarking, you are either overpaying in low-cost markets or underpaying in high-cost ones, and both outcomes carry real financial and talent risk.
3. The Hidden Cost of Skipping a Comp Review
Replacing an employee costs 50 to 200 percent of their annual salary. For a ten-person engineering team earning $150,000 each, losing three people to pay dissatisfaction costs roughly $225,000 to $900,000, before accounting for lost productivity. That is not an HR problem. That is a P&L problem. The CFO cares, even if the request comes from People Ops.
4. Top Performers Leave Before You Run the Numbers
Employees with options rarely wait for a comp cycle. They compare offers and make decisions long before HR flags an issue in a quarterly review. By the time exit interviews surface pay as a concern, the damage is done. Proactive analysis is the only way to stay ahead of this.
5. CFOs Now Expect Comp Data at Every Planning Cycle
Workforce cost is one of the largest line items on any operating budget. As HR teams push for a seat at the strategic table, the expectation is that compensation decisions come with data.
So your CFOs and FP&A teams may want to see compa-ratios, pay band utilization, and the budget impact of proposed adjustments for each planning cycle.
.png)
So, the case for acting is clear. The next question is how. Here is a step-by-step process built for scaling U.S. companies, designed to produce real decisions.
Also Read: Understanding the Role of Compensation and Benefits Managers

How to Do a Compensation Analysis in 9 Steps
Running a compensation breakdown sounds complex. It doesn't have to be. Here is a proven, step-by-step approach built for scaling U.S. companies, whether you are doing this for the first time or trying to make an existing process more rigorous.
Step 1: Define Your Scope and Business Goal
Are you doing this because of high attrition? A funding round? Geographic expansion? A new pay equity law in your state? The answer shapes what data you collect first. A company focused on retention looks at compa-ratios and tenure. A company preparing for a Series B cares about competitive offer data. Start with the 'why' before you touch the data.
Step 2: Audit and Clean Your Internal Comp Data
Before you can benchmark anything, you need clean internal data. Pull current salaries, job titles, levels, locations, tenure, and demographics from your HRIS.
Most scaling companies find inconsistencies here, duplicate job titles, missing levels, and roles that were never mapped to a grade. Fix this first. Benchmarking wrong data produces misleading results.
Step 3: Standardize Your Job Architecture First
You cannot benchmark a 'Senior Software Engineer' if your leveling framework hasn't defined what that title actually means. Job architecture, the system of job families, levels, and grades that maps your org, is the foundation. Without it, you are comparing apples to oranges.
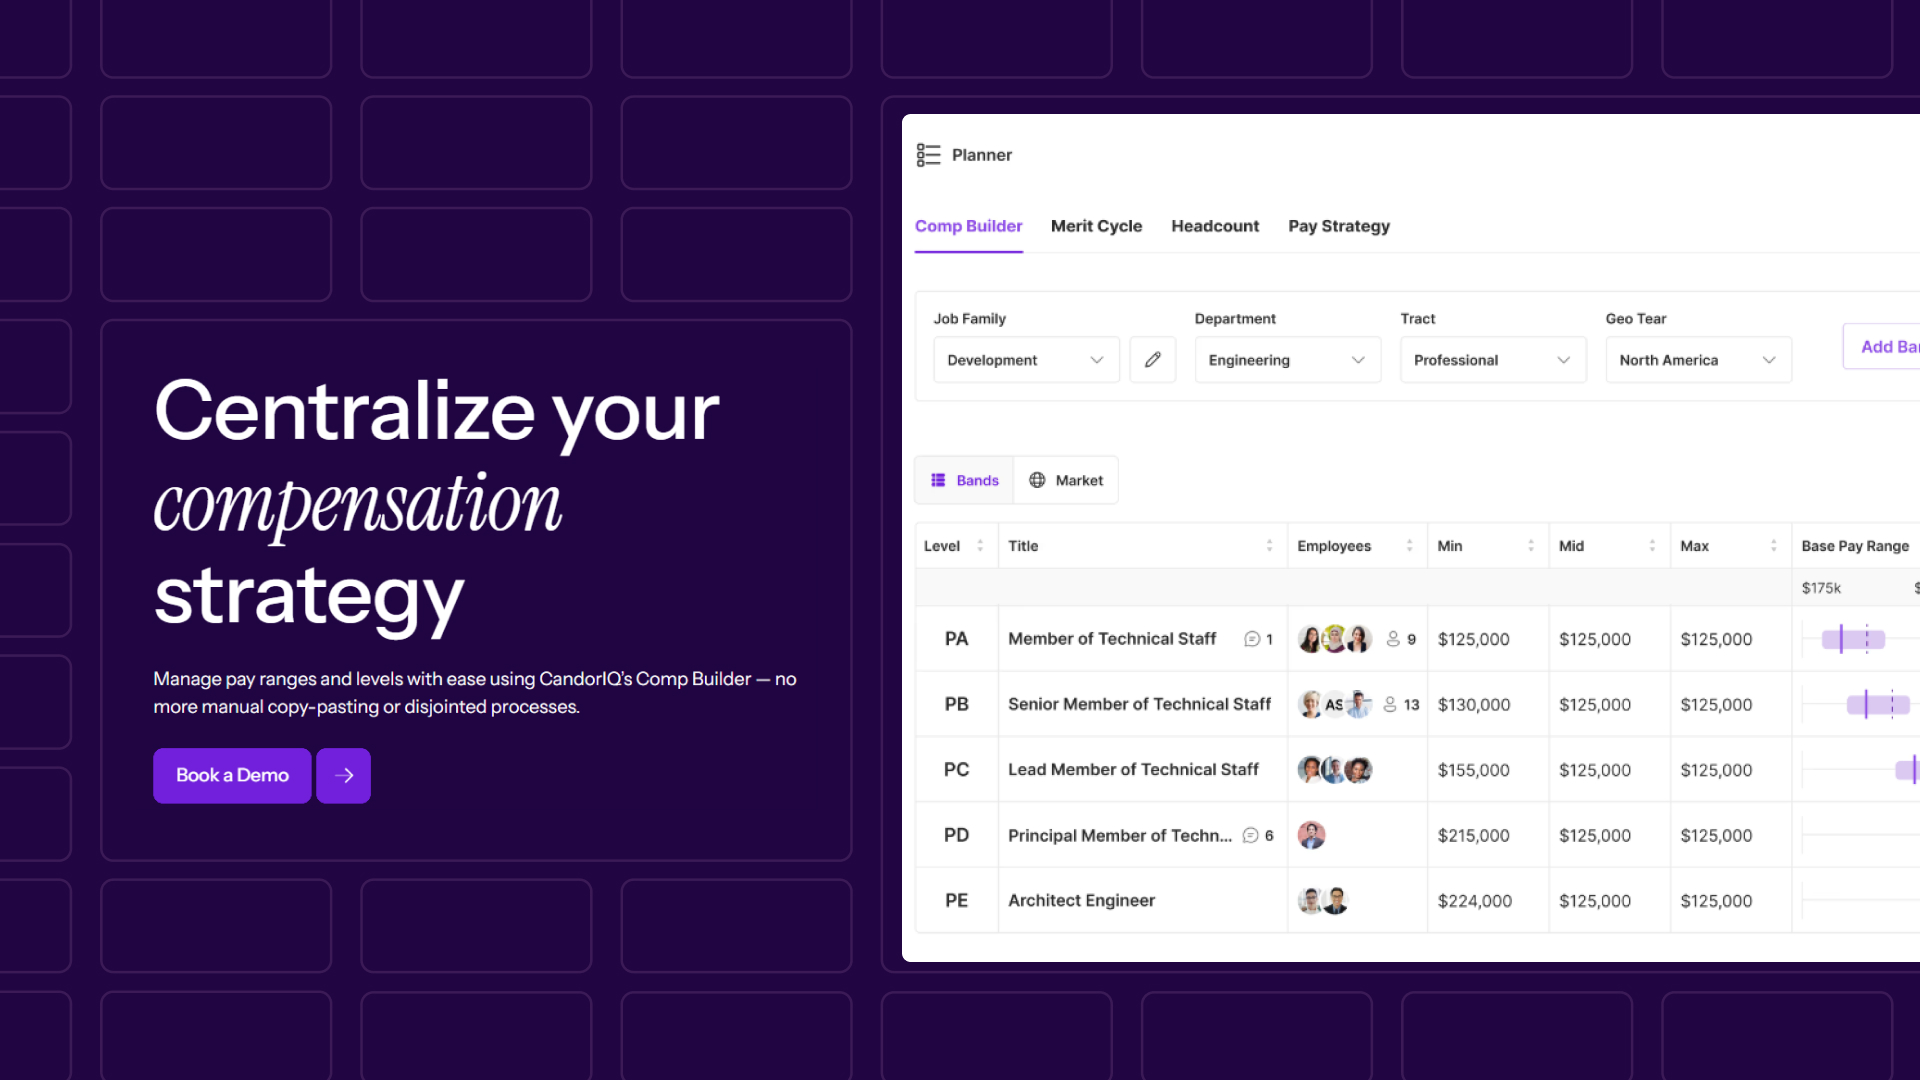
CandorIQ's Compensation and Payband Builder helps teams define pay bands by level, location, and department, so benchmarking has a structured foundation to work from.
Step 4: Pull Market Data From the Right U.S. Sources
Not all data sources are equal. Match the source to the use case:
- Radford / Aon: Best for tech and life sciences; detailed level-by-level data.
- Mercer: Strong for enterprise roles and cross-industry comparisons.
- Levels.fyi: Ideal for benchmarking software engineering roles at tech companies.
- BLS OES: Free, reliable baseline data for non-technical U.S. roles.
- Glassdoor / LinkedIn: Useful directional data; less precise at the level-by-level detail.
Triangulate across at least two sources. Single-source benchmarking is one of the most common mistakes teams make, which we will come back to shortly.
Step 5: Compare Pay by Role, Level, and Geography
Now run the comparison. Calculate compa-ratios. A compa-ratio below 80 is a red flag. Above 120 may indicate overpayment relative to the market. Do this by geography, too. A $130,000 base in San Francisco is not the same competitive position as $130,000 in Nashville.
Step 6: Spot the Red Flags in Your Comp Data
Look for: employees with below-80 compa-ratios, pay gaps across demographic groups at the same level, salary compression between new hires and tenured staff, and roles where your pay bands haven't been updated in over 18 months. These are the four most common patterns that surface in a compensation study for growing U.S. teams.
Step 7: Build an Action Plan Within Budget
Not every gap can be fixed immediately. Prioritize by risk: start with flight-risk employees, hard-to-fill roles, and any pay equity gaps with legal exposure. Build a phased adjustment plan that Finance can approve, including immediate corrections, plus a 12-month roadmap for the rest. Bring the CFO into this step, not after it.
Step 8: Communicate Geo-Pay Differences Fairly
Geo-differentiated pay is logical. Explaining it to employees is harder. If a Denver-based engineer earns less than their San Francisco counterpart for the same role, that needs a clear, consistent rationale, tied to your documented pay philosophy, not improvised by a manager. Train your managers on the talking points before any changes roll out.
Step 9: Build a Continuous Compensation Intelligence Practice
A one-time analysis expires quickly. Markets move. Headcount changes. New pay transparency laws pass. The companies that win on talent treat compensation as a live data stream.
Set a minimum cadence of semi-annual reviews, and trigger off-cycle reviews when you hit a hiring surge, a geographic expansion, or a new regulatory requirement.
.png)
Following these nine steps gets you most of the way there. But even well-intentioned teams make avoidable errors that quietly undermine the entire process. Here are the six that show up most often, and how to sidestep them.
Also Read: Creating an Effective Employee Compensation Plan
Mistakes You Could Make in Compensation Analysis
Knowing the steps is half the job. Knowing where teams go wrong is the other half. These are the most common mistakes HR and finance teams make, and what to do instead.
- Ignoring Geo-Pay Gaps on Distributed Teams: If your pay bands were designed for one location, they are probably wrong for a distributed workforce. Remote-first teams that hire across the U.S. without geo-adjusted benchmarking are either overpaying in low-cost markets or under-competing in high-cost ones. Neither is sustainable.
- Matching Job Titles Instead of Job Scopes: A 'Product Manager' at a 40-person startup and a 'Product Manager' at a 500-person company are different jobs. Matching by title without matching by scope and level produces misleading benchmarks. Always define the role in terms of responsibilities and impact before you benchmark it.
- Treating Pay Equity as a Compliance Checkbox: Pay equity analysis done only to satisfy a legal requirement misses the point. Equity gaps compound quietly. Regular analysis surfaces them before they become lawsuits or headlines.
- Not Linking Comp Analysis to Headcount Planning: Compensation decisions do not live in a silo. Every new hire, promotion, and backfill affects your pay band utilization, budget, and internal equity. Running comp analysis separately from headcount planning means you are making decisions without seeing the full picture.
- Ignoring National Benchmark vs. Local Market Rates: There is no single 'US market rate' for most roles. Whether to pay a national median with geo modifiers or to local market rates directly is a deliberate strategic choice.
Avoiding these mistakes is easier when your compensation data, pay bands, and headcount plans all live in one place, rather than scattered across spreadsheets that no one fully trusts. That's exactly the problem CandorIQ was built to solve.
Stop Running Compensation Analysis in Spreadsheets
Managing compensation across spreadsheets, disconnected salary surveys, and siloed HR systems creates real problems at scale. When leadership asks for a consolidated view, it takes days to build one that is already out of date.
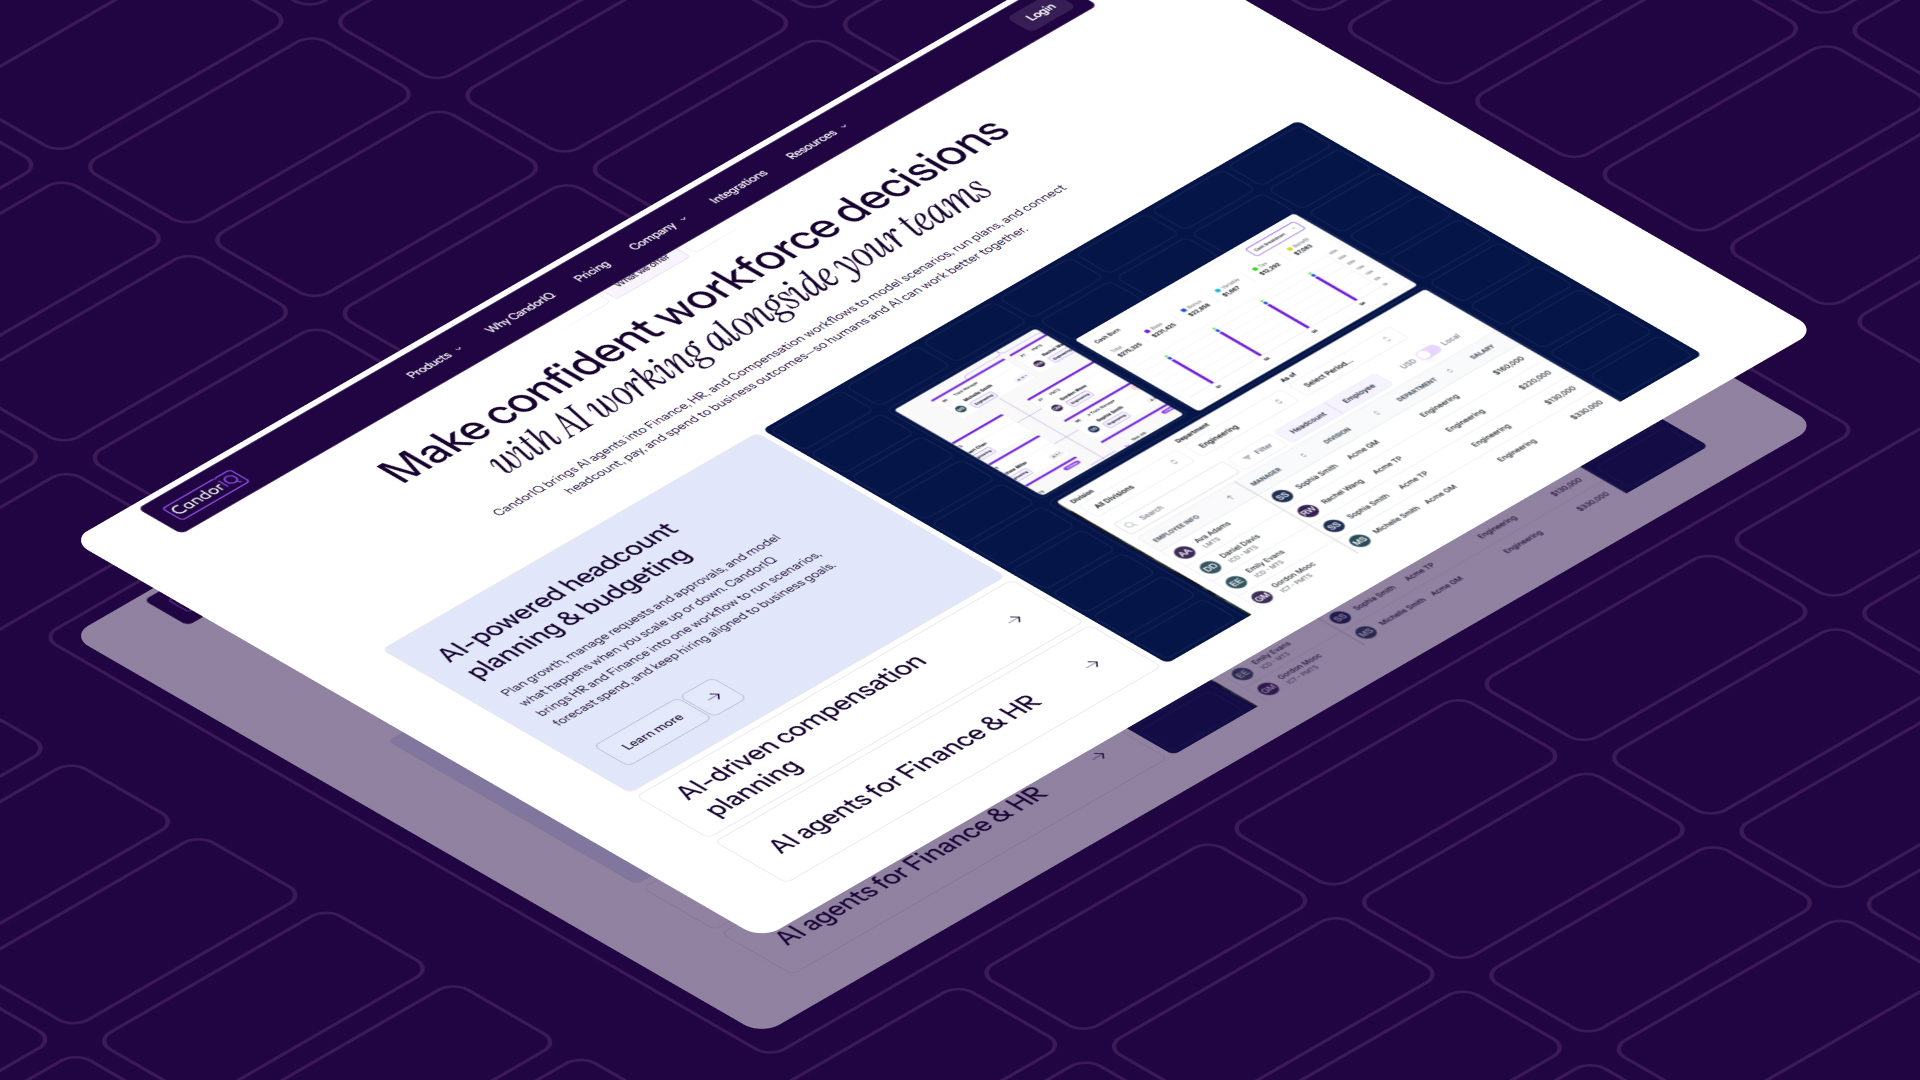
CandorIQ brings compensation analysis, pay band management, and headcount planning into a single platform. It is built for HR and finance teams at scaling U.S. companies that need structure, transparency, and real-time collaboration, without the manual overhead.
Here is how CandorIQ maps to the workflows covered in this guide:
- Compensation and Payband Builder: Define and manage pay bands by level, location, and department. Apply geo-adjusted salary benchmarks and visualize pay distribution across your workforce in real time.
- Compensation Cycle: Automate merit and bonus reviews with built-in approval logic. Track budgets and raises by department, and cut cycle time from weeks to days.
- Headcount Scenario Planning: Model hiring scenarios and their budget impact before they become commitments. Align People Ops and Finance on workforce plans that reflect reality.
- Workforce Management: Track open roles, attrition, and compensation actuals vs. plan in one dashboard, built for execs, HRBPs, and finance teams.
- AI Agent: Ask natural language questions to surface comp gaps, model adjustments, and forecast headcount impact, purpose-built to support strategic decision-making at scale.
CandorIQ replaces the spreadsheet patchwork that slows most teams down with the kind of real-time visibility that makes compensation a strategic advantage.

FAQs
How is compensation analysis different from a compensation audit?
A compensation audit is typically a one-time, often legally triggered review — usually done in response to an equity complaint or a new regulation. Compensation analysis is broader and ongoing. It covers benchmarking, equity, job architecture, and total rewards — and should happen on a recurring cadence, not just when something goes wrong.
What is a good compa-ratio, and what does it tell you?
A compa-ratio measures how an employee's salary compares to the market midpoint for their role. A ratio of 100 means they are paid exactly at market. Below 80 is a retention risk. Above 120 may indicate misalignment between pay and role scope. For distributed U.S. teams, compa-ratios should be calculated by geography, not just against a single national benchmark.
Which U.S. states require employers to post salary ranges in job listings?
As of 2026, Colorado, California, New York, Illinois, Washington, and several other states require salary range disclosures in job postings. Remote roles posted by companies with employees in those states are often subject to the same requirement. If you post a remote role without a range, you may be non-compliant in multiple states simultaneously.
What is the difference between pay equity and pay equality?
Pay equality means everyone is paid the same amount. Pay equity means everyone is paid fairly based on their role, level, and experience — without unexplained gaps tied to gender, race, or other protected characteristics. Pay equity is what the law requires and what drives employee trust. Pay equality, without context, can actually introduce its own inequities.
Can you run a compensation analysis without dedicated HR software?
Yes, but with significant limitations. Spreadsheet-based analysis works for teams under 50 employees. Beyond that, inconsistent data, manual errors, and the inability to model scenarios in real time make the process unreliable. For companies managing multiple geographies, roles, and comp cycle timelines, purpose-built platforms provide the accuracy and speed that spreadsheets cannot.
Ready to modernize your workforce and compensation strategy?
See how CandorIQ brings workforce planning and compensation together with AI.