Creating a Total Rewards Template: A Step-by-Step Guide
Create your total rewards template by defining its purpose, customizing components, and highlighting value. Include perks and services. Click to start!

Did you know 48% of HR leaders are increasing their tech spending in 2024? Despite this, many still rely on fragmented spreadsheets for total rewards planning. This creates hidden budget gaps, costing scaling organizations millions in unplanned compensation expenses.
For CPOs and CFOs managing distributed teams with limited resources, a unified approach can turn chaotic headcount planning into predictable budget governance.
In this guide, you will learn how to structure data for real-time decisions, ensure compliance across locations, and give leadership clear visibility into hiring costs. Whether standardizing compensation bands or achieving budget predictability during growth, this guide provides a framework to scale compensation strategically.
At a glance:
- A total rewards template consolidates base pay, bonuses, equity, benefits, PTO, and perks into one system, eliminating fragmented spreadsheets and budget blind spots for scaling companies.
- Employees underestimate their compensation because they only see their base salary. Your template shows the full picture: what looks like a $110K offer may pale against their actual $178K total package.
- Seven-step build process: Define compensation philosophy → map all components → assign dollar values → structure template → create salary bands → automate data → plan rollout.
- Dual purpose: Internal budget planning for leadership (forecasting, scenarios, cost tracking) + external value communication for employees (individual statements).
- Start with Excel/Sheets until 100-150 employees, then migrate to platforms that integrate with HRIS, payroll, and equity systems for automation.
- Enhance with visuals, market benchmarks, and role-based access, making data scannable and relevant for each stakeholder level.
- Update annually minimum, quarterly when scaling, aligned with review cycles and major compensation changes.
What is a Total Reward Statement?
A total rewards statement is a personalized document that provides an overview of your complete compensation package beyond base salary.
Most employees underestimate their compensation by 20-30% because they only see their paycheck. They miss the employer-paid benefits, equity value, and hidden perks that significantly increase their total package.
What Gets Included in a Total Rewards Statement
The template you build serves dual purposes: internal budget planning for leadership and external value communication for employees. One document, two critical functions. Here’s what gets included in this template:
- Base pay and bonuses
- Equity grants and stock options
- Healthcare benefits and insurance
- Retirement contributions
- Paid time off
The statement translates abstract benefits into dollar amounts. Instead of "health insurance provided," employees see "$18,000 annual employer contribution."
For scaling companies, this clarity is strategic. When employees feel they're rewarded fairly, it keeps them engaged and improves retention. A well-structured total reward statement becomes your retention tool during competitive hiring markets.
As organizations evolve their approach to compensation, understanding how AI transforms modern total rewards programs becomes essential for staying competitive.
6 Reasons You Can't Afford to Skip the Total Reward Statement?

Your template provides the foundation for auditing compensation decisions, identifying inequities early, and documenting your pay philosophy defensibly. Here's why building this template becomes mission-critical for scaling companies:
- Closes the Compensation Perception Gap: Employees routinely undervalue their total package. They see their base salary and mentally ignore everything else your company invests in them. When employees have a clear understanding of their total rewards, satisfaction and engagement improve. The template quantifies every dollar, eliminating guesswork.
- Strengthens Retention in Competitive Markets: Employees who rate their organizational culture as poor are more likely to consider quitting. A structured template shows employees what they'd lose by leaving. That visibility creates friction against opportunistic job-hopping.
- Enables Accurate Budget Forecasting: Fragmented data across payroll, benefits admin, and equity platforms creates forecasting blind spots. One consolidated template gives finance teams real numbers for scenario planning. You can model growth impacts before making hiring commitments.
- Standardizes Compensation Across Distributed Teams: Managing compensation for remote teams across multiple locations can be complex. Different benefit costs, tax implications, and market rates multiply quickly. The template creates consistency in how you calculate and communicate total rewards, regardless of where employees sit.
- Reduces Administrative Burden on Lean Teams: HR teams in growth-stage companies juggle multiple systems, one for payroll, another for benefits, a third for equity. Pulling reports from each platform for a single hire consumes hours. A unified template eliminates duplicate data entry and creates a single source of truth.
- Supports Compliance and Pay Equity: In today's transparency-focused world, pay equity issues can become PR disasters, and fixing historical gaps can cost millions in back pay and adjustments.
You've established why this matters. Now here's how to actually build it.
.png)
Also Read: How to Strengthen Your Employee Value Proposition and Total Rewards
How to Build Your Total Rewards Template: The Seven-Step Framework
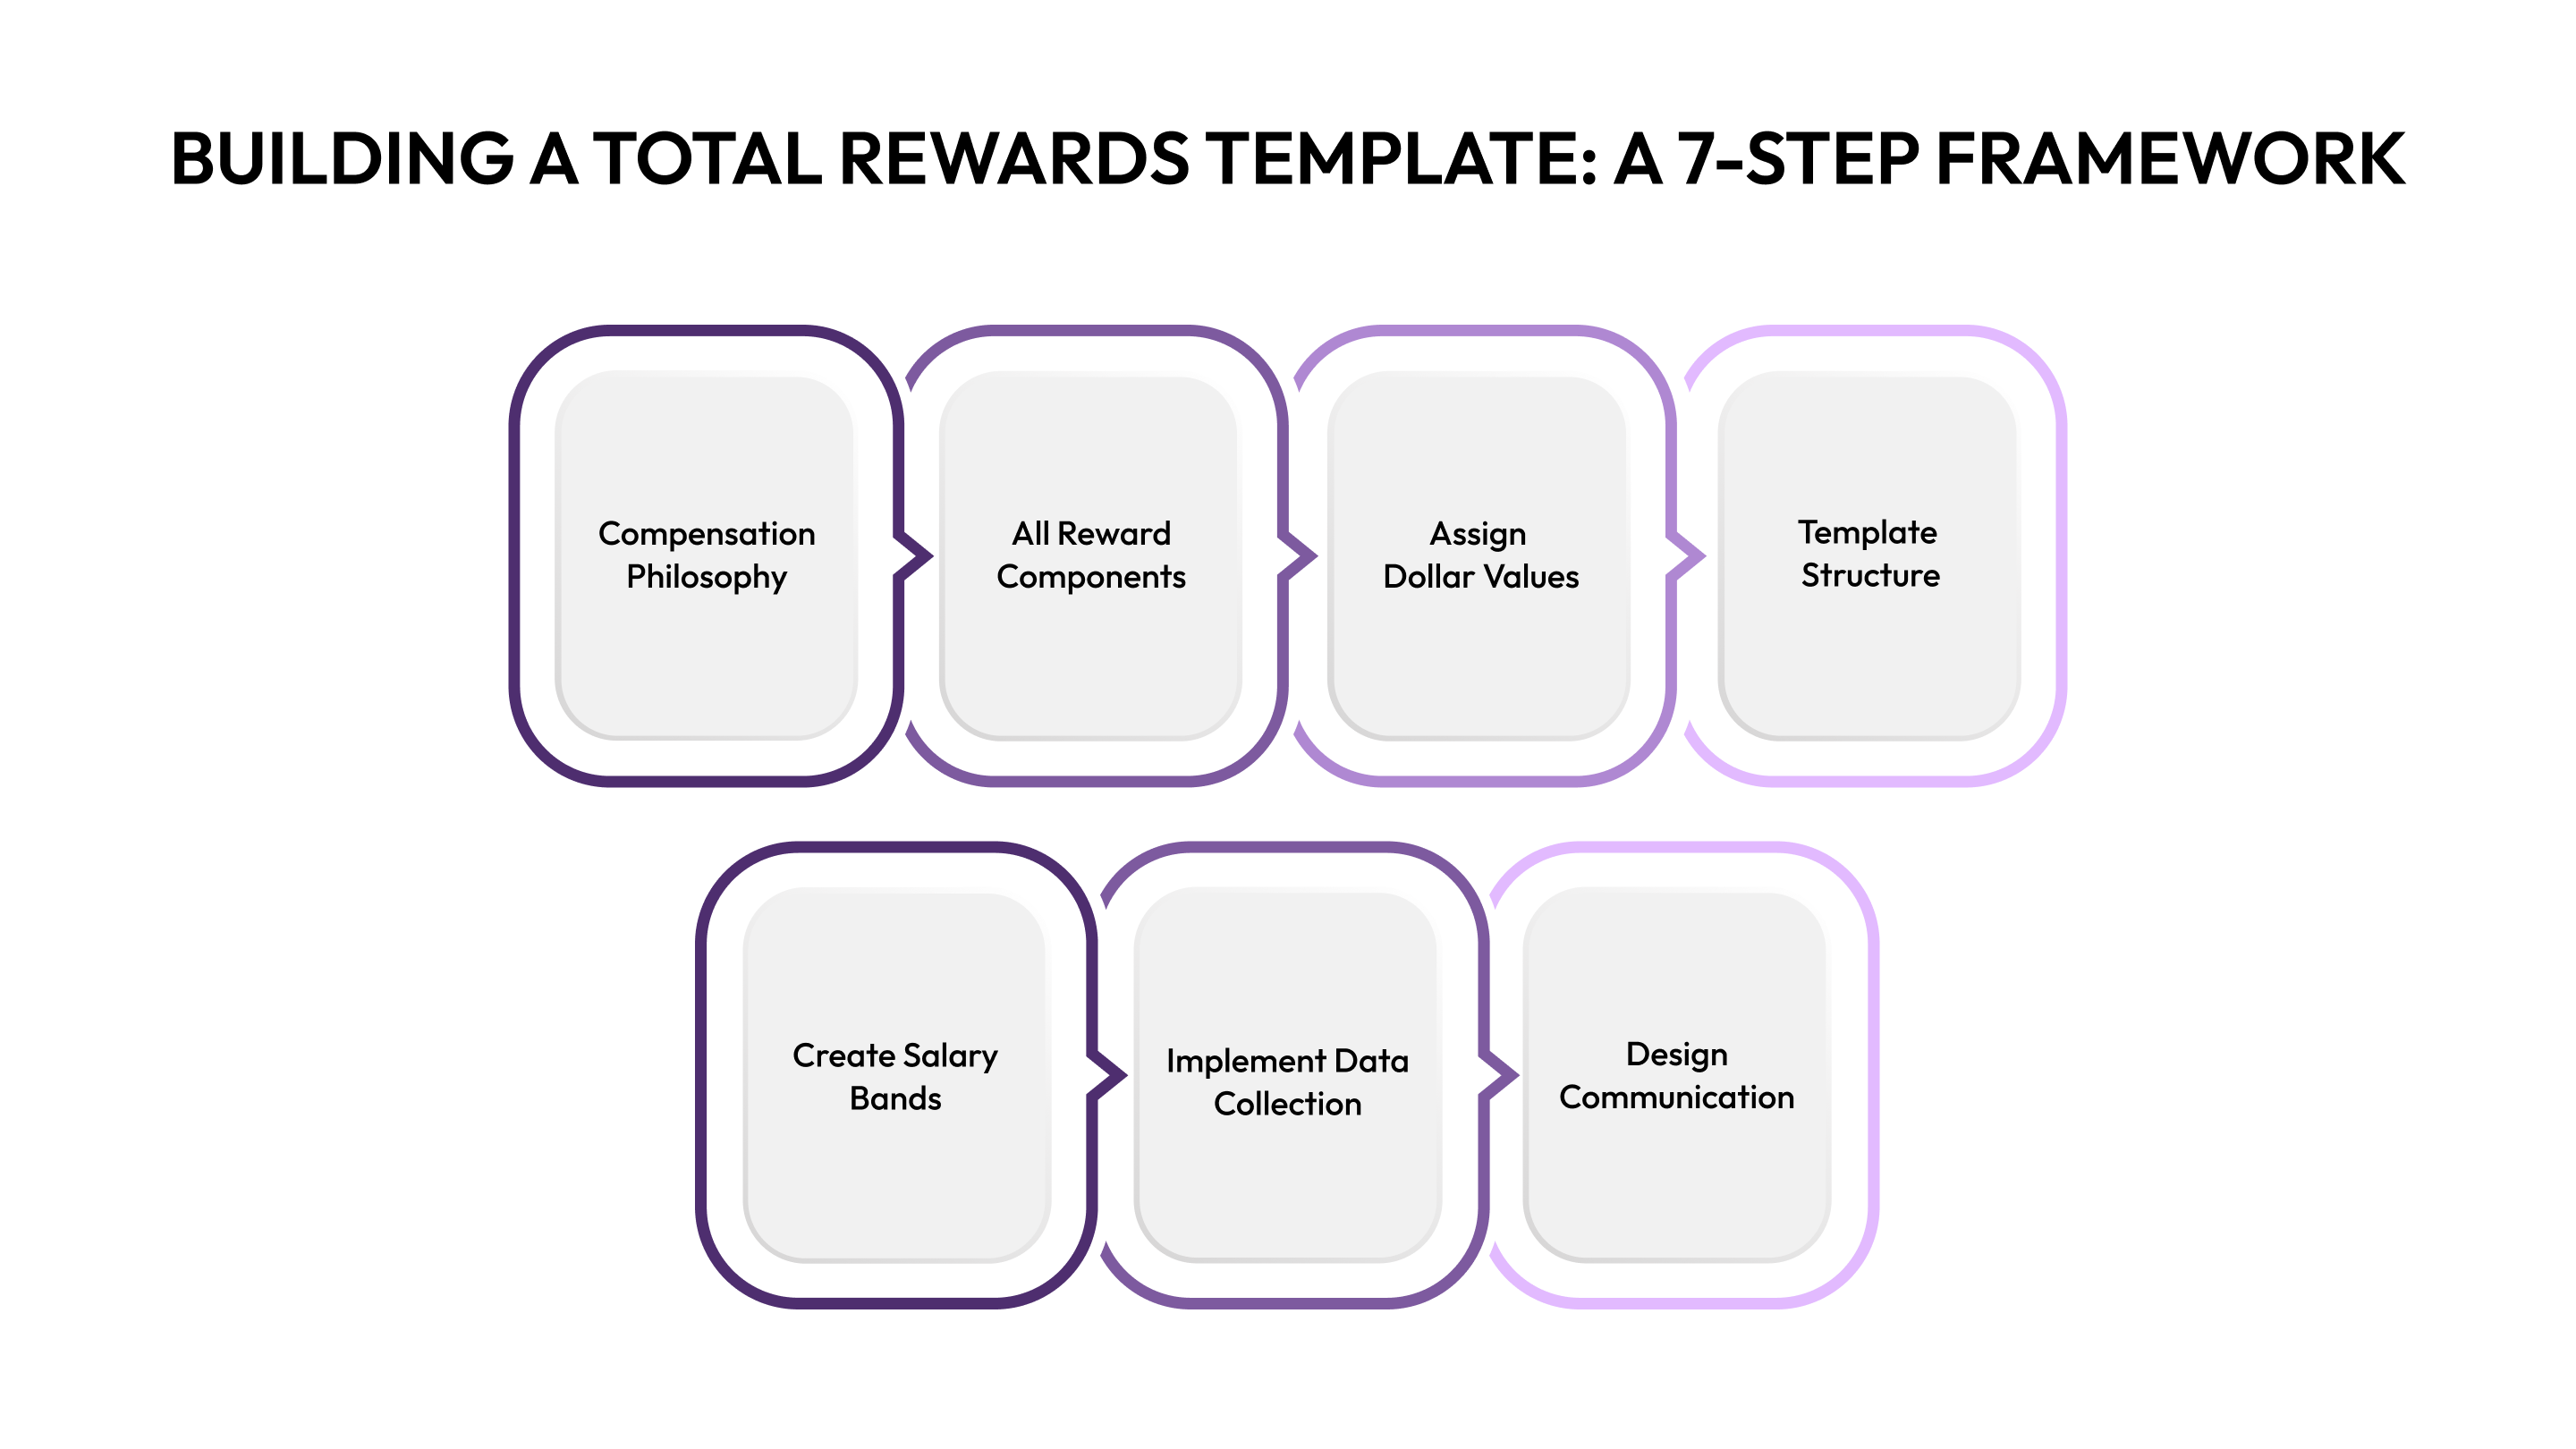
The process of building a total rewards template takes you from scattered data to a functioning system that scales with your organization.
Here’s the step-by-step process:
Step 1: Define Your Compensation Philosophy
Before opening a spreadsheet, document how you approach pay. Your philosophy should address market positioning (whether employees are paid at, above, or below market rates), how equity compensation will be granted and to whom, and how incentive pay links to employee or company performance.
Answer these questions clearly:
- Do you pay at the 50th, 75th, or 90th percentile of market rates?
- How does performance impact compensation?
- What's your stance on pay transparency?
- How do you handle geographic pay differences for remote teams?
This philosophy becomes the foundation for every compensation decision. Without it, you're making ad hoc choices that create inconsistencies.
Developing a comprehensive compensation philosophy requires more than answering these questions in isolation. Learn how to build a cohesive total rewards strategy that aligns every compensation decision with your broader business objectives.
Step 2: Identify All Reward Components
Common components to include are base pay, bonuses, equity grants, healthcare benefits, retirement plans, life insurance, and paid time off. Don't stop at the obvious items. Capture everything that costs your organization money:
Direct compensation:
- Base salary
- Performance bonuses
- Commission structures
- Equity (options, RSUs)
Benefits:
- Health, dental, vision insurance (employer portion)
- 401(k) matching
- Life and disability insurance
- Flexible spending accounts
Time off:
- Vacation days
- Sick leave
- Parental leave
- Company holidays
Perks and development:
- Learning stipends
- Home office budgets
- Wellness programs
- Professional development
Audit your current offerings across all departments. Finance may track some items, HR others, and IT a third set. Consolidate everything into one master list.
Managing diverse rewards components becomes more complex in a multigenerational workforce. Gen Z may prioritize learning stipends, while Gen X values retirement matching. Learn how to create a total rewards strategy for a multigenerational workforce.
Step 3: Assign Dollar Values to Each Component
This is where abstract benefits become concrete numbers. Every item needs a calculable annual value.
For fixed costs like insurance, use the employer's annual contribution. For time off, calculate based on daily salary rates. A $100,000 employee earning 20 vacation days receives $7,692 in PTO value annually.
Equity requires special handling. Use the grant date fair value, not future projections. For unvested equity, show the total value and vesting schedule.
Create standardized formulas for each component. This ensures consistency when calculating statements for 50 or 500 employees.
Step 4: Build Your Template Structure
Use clear, simple language to explain each component of the statement, avoiding jargon and providing detailed explanations where necessary.
Structure your template in two sections: the planning worksheet (internal) and the communication statement (employee-facing).
Planning worksheet includes:
- Employee identifiers (name, role, level, location)
- Each compensation component with formulas
- Budget allocation by department
- Scenario modeling fields
- Approval workflows
Communication statement includes:
- Total compensation summary
- Component breakdown with values
- Visual representation (charts work well)
- Comparison to market data (optional)
Use Excel or Google Sheets initially. As you scale, consider dedicated compensation management platforms, but validate your structure with spreadsheets first.
Step 5: Create Salary Bands and Pay Ranges
Salary bands group jobs by similar roles or job families and assign a range of pay, with minimum, midpoint, and maximum amounts determined by role expectations, geography, skills, and experience.
Establish bands for each role level in your organization. A typical structure includes:
- Minimum (entry level for the role)
- Midpoint (fully competent performer)
- Maximum (top performer with extensive experience)
Each band should have a 30-50% spread from minimum to maximum. Narrower bands create compression issues; wider bands make progression unclear.
Reference market data from sources like Radford, Pave, or Comprehensive for your industry. Adjust for your compensation philosophy and geography.
Step 6: Implement Data Collection and Maintenance Processes
Templates only work if data stays current. Establish clear ownership and update cadences.
Assign responsibility:
- HR updates salary changes and new hires
- Finance updates benefit costs quarterly
- Equity team updates vesting schedules monthly
Integrate with your existing systems where possible. Pull payroll data automatically rather than manual entry. Set calendar reminders for benefit cost updates from brokers.
Build validation checks into your template. Flag outliers, missing data, or values outside normal ranges. Catch errors before they reach stakeholders.
Step 7: Design Communication and Rollout
The best template fails if stakeholders don't understand or use it. Plan how you'll introduce and maintain the system.
- For leadership, focus on budget visibility and forecasting capabilities. Show CFOs how the template prevents compensation surprises and enables scenario planning.
- For employees, emphasize value transparency. Roll out individual statements during performance reviews or annual compensation cycles.
Provide training documentation. Create quick-start guides for managers who need to generate statements for their teams. Record video walkthroughs for common tasks.
Schedule quarterly reviews to refine the template based on user feedback and changing business needs. Your first version won't be perfect; plan for iteration.
Now that you've built the structure, the question is, will it be enough to cut through the competitive HR landscape?
As your template scales, consider how to structure your total rewards strategy to ensure adequate oversight, data accuracy, and strategic execution across all compensation components.
Five Ways to Transform Your Total Reward Template From Functional to Exceptional
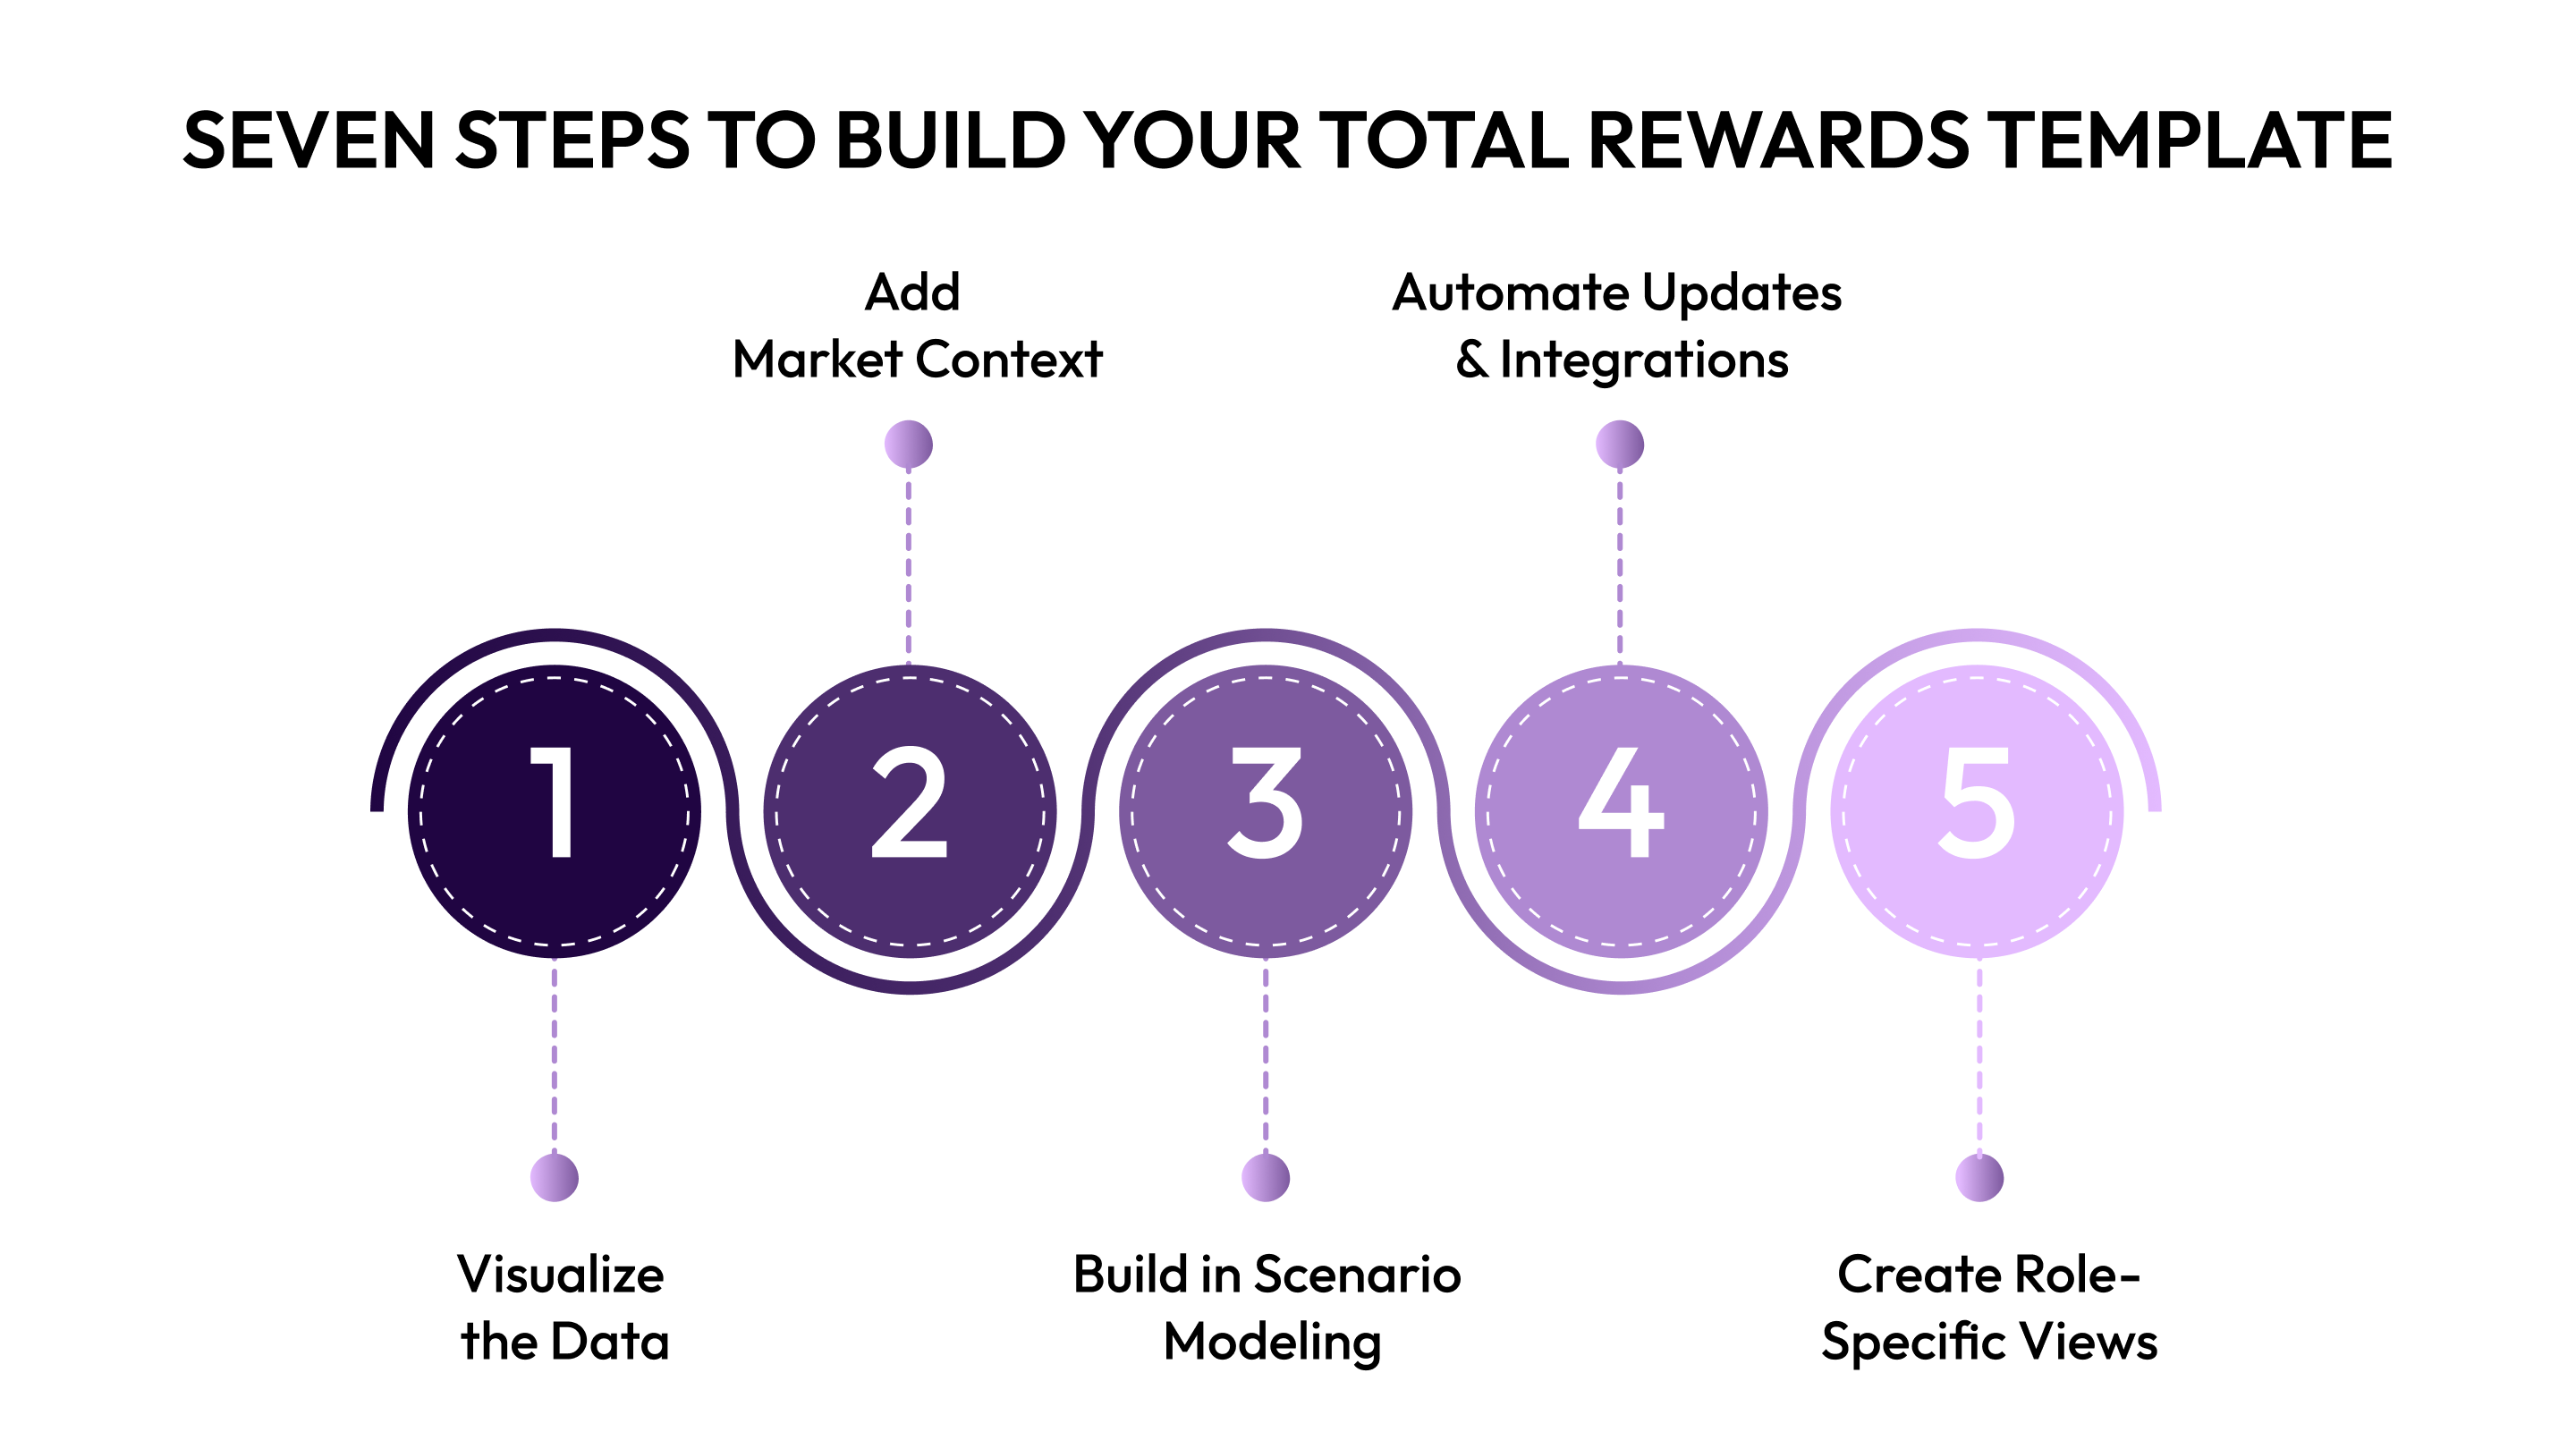
Effective communication of Total Rewards Statements is essential for maximizing their impact through clear messaging, multimedia tools, feedback mechanisms, and regular updates.
1. Visualize the Data
Numbers alone don't create impact. 80% of employees would opt for additional benefits instead of a pay raise, yet most can't quantify what their benefits are worth.
Add to employee statements:
- Pie charts showing compensation mix (cash vs. benefits vs. equity)
- Bar graphs comparing packages to market benchmarks
- Icons for each benefit category
- Color coding to differentiate component types
For planning views, use conditional formatting to highlight when salaries exceed bands, equity grants need refresh, or budgets approach limits.
2. Add Market Context
Show percentile positioning: "Your total package is at the 70th percentile for Senior Product Managers in Austin."
Helping employees understand the total rewards program and its value contributes to higher employee satisfaction and increases the organization's position as an employer of choice.
Source data from comprehensive surveys, or CandorIQ. Update quarterly. For distributed teams, include location-adjusted comparisons.
3. Build in Scenario Modeling
Add interactive tabs to the model:
- Headcount growth impact (What does adding 10 engineers cost?)
- Promotion cycle budgets (15% of staff promoted)
- Market adjustments (bringing everyone to the 60th percentile)
- Benefits changes (switching health plans)
Use dropdowns and data validation. Select department, role, hire count—see instant budget impact.
4. Automate Updates and Integrations
Connect to source systems via API or scheduled exports. Pull payroll data, benefits costs, equity schedules, and employee changes automatically.
Leverage a multi-channel approach that includes an interactive digital dashboard, quarterly updates, and personalized statements to ensure employees fully understand their compensation. CandorIQ can be a great help on this.
For teams without technical resources, use Excel Power Query or Google Sheets' IMPORTDATA function. Set quarterly reminders for benefit cost updates.
5. Create Role-Specific Views and Control Access
Not everyone needs the same information depth or access level.
- Employees: Individual statement only
- Managers: Team summary with department budget
- HR partners: Full department visibility
- Executives: Enterprise dashboards with forecasting
Provide basic communication explaining the statement and its value, along with support guides that explain terminology, and an opportunity for employees to ask questions via Q&A.
Use Excel's protect features or Google Sheets permissions. Add a glossary tab for terms like "vesting" or "HSA match."

Conclusion
You've got the framework. Seven steps that replace spreadsheet chaos with strategic infrastructure. Define philosophy, map components, assign values, build structure, establish bands, automate data, and plan rollout.
The template closes the 20-30% compensation perception gap. It gives CFOs budget predictability. It shows employees why they should stay.
But spreadsheets hit limits at scale. Manual updates break down. Integrations become complex. Scenario planning requires constant rebuilding.
CandorIQ handles this exact transition point. The platform manages compensation, headcount planning, and total rewards in one system, integrated with your existing HRIS, ATS, and cap table. Automate what you've built manually. Run merit cycles in days instead of months. Give employees transparent access to their total rewards statements.
Start with your template. When you're ready to scale beyond it, see how CandorIQ accelerates what you've already built.
Frequently Asked Questions
1. Do we need different templates for contractors versus full-time employees?
Yes. Contractors typically don't receive benefits, equity, or PTO. Create a simplified version showing hourly/project rate, any contracted perks (equipment stipends, specific tools), and payment schedule. Keep the structure similar but remove inapplicable sections to avoid confusion or compliance issues.
2. How do we handle confidential salary information when sharing templates?
Never share templates containing others' compensation data. Generate individual statements for each employee showing only their information. For managers needing team visibility, create summary views with anonymized data or salary band ranges—not individual names with specific amounts. Use role-based permissions to control access.
3. What if our benefits costs vary significantly by location?
Show location-specific values in each employee's statement. A health insurance plan costing $12,000 in one state might cost $16,000 in another. Your master template should include location-based rate tables that auto-populate the correct values. This is critical for distributed teams to ensure accurate total compensation representation.
4. How technical does our team need to be to build this?
Basic Excel or Google Sheets proficiency is sufficient initially. You need to understand formulas (VLOOKUP, SUM, IF statements), cell references, and basic formatting. No coding required. As you scale beyond 150-200 employees, consider transitioning to dedicated platforms that automate data pulls and updates.
Ready to modernize your workforce and compensation strategy?
See how CandorIQ brings workforce planning and compensation together with AI.