7 Workforce Management Dashboards HR and Finance Need in 2026
Learn what a workforce management dashboard is, why it matters, 7 useful examples, how to choose the right one, and mistakes that reduce its value today.

Your workforce data sits across payroll, hiring, scheduling, and HR systems, but the decision still lands in one meeting. Without a workforce management dashboard, HR and Finance spend too much of their meeting time reconciling numbers instead of deciding what to approve, adjust, or prioritize.
That delay shows up quickly in workforce planning. A backfill stays open longer than expected, overtime trends surface too late, or labor costs shift before the team sees the full impact on headcount plans. As workforce management software investment grows from USD 9.36 billion in 2025 to USD 9.76 billion in 2026, the real differentiator is not having more data. It has one view that makes staffing, cost, and planning decisions easier.
In this guide, we’ll walk through what a workforce management dashboard should help teams see, which dashboard views matter most, how to choose the right one, and where teams often get stuck.
Key Takeaways
- A workforce management dashboard brings headcount, payroll, time, and cost data into one live view, so HR and Finance can make faster staffing and workforce planning decisions.
- The most useful dashboards improve budget control by tracking labor spend, scheduled versus actual hours, hiring pressure, and future capacity gaps before costs drift.
- Different dashboard views solve different planning problems, from headcount alignment and workforce cost control to compensation visibility, hiring approvals, attrition risk, and executive planning.
- The right dashboard should match the decision you need to make most often, support quick action, fit the user, and pull data together without manual reconciliation.
- Dashboards lose value when they overload users with metrics, stale data, weak definitions, or disconnected sources, while CandorIQ helps unify planning, approvals, compensation, and workforce spend in one system.
What Is a Workforce Management Dashboard?
A workforce management dashboard brings together HR, payroll, time, and cost data in one live view. It helps HR and finance teams track staffing, labor spend, productivity, and workforce trends, then act faster on hiring, scheduling, compensation, and organizational planning decisions.
Why Workforce Dashboards Matter for Budget Control and Hiring Decisions
A dashboard matters because it gives Finance and HR one live view of labor spend, staffing gaps, scheduling variance, and hiring pressure. That makes it easier to control payroll costs, catch budget drift early, and approve roles based on forecasted capacity needs instead of delayed reports.
The priorities below show where workforce dashboards create tighter financial control and more disciplined hiring decisions.
- Labor Spend Visibility: Tracks cumulative wage spend, overtime growth, and department-level budget variance before cost overruns appear in month-end reporting.
- Scheduled Vs. Actual Hours: Shows whether planned staffing hours match worked hours, helping managers catch scheduling inefficiencies that quietly inflate labor costs.
- Capacity Gap Forecasting: Uses projected workload and staffing demand to show where future hiring needs are likely to emerge before service levels drop.
- Funnel Conversion Tracking: Measures applicant-to-interview, interview-to-offer, and offer-to-acceptance rates so hiring teams can fix bottlenecks earlier.
- Retirement Risk Mapping: Flags age and tenure patterns that signal upcoming retirement waves, helping teams plan replacement hiring before critical skills disappear.
Used well, workforce dashboards turn labor data into faster budget decisions, cleaner hiring approvals, and stronger workforce planning without waiting for fragmented reports.
Teams looking at broader platform options for workforce visibility and control can continue with best all-in-one workforce management software
.png)
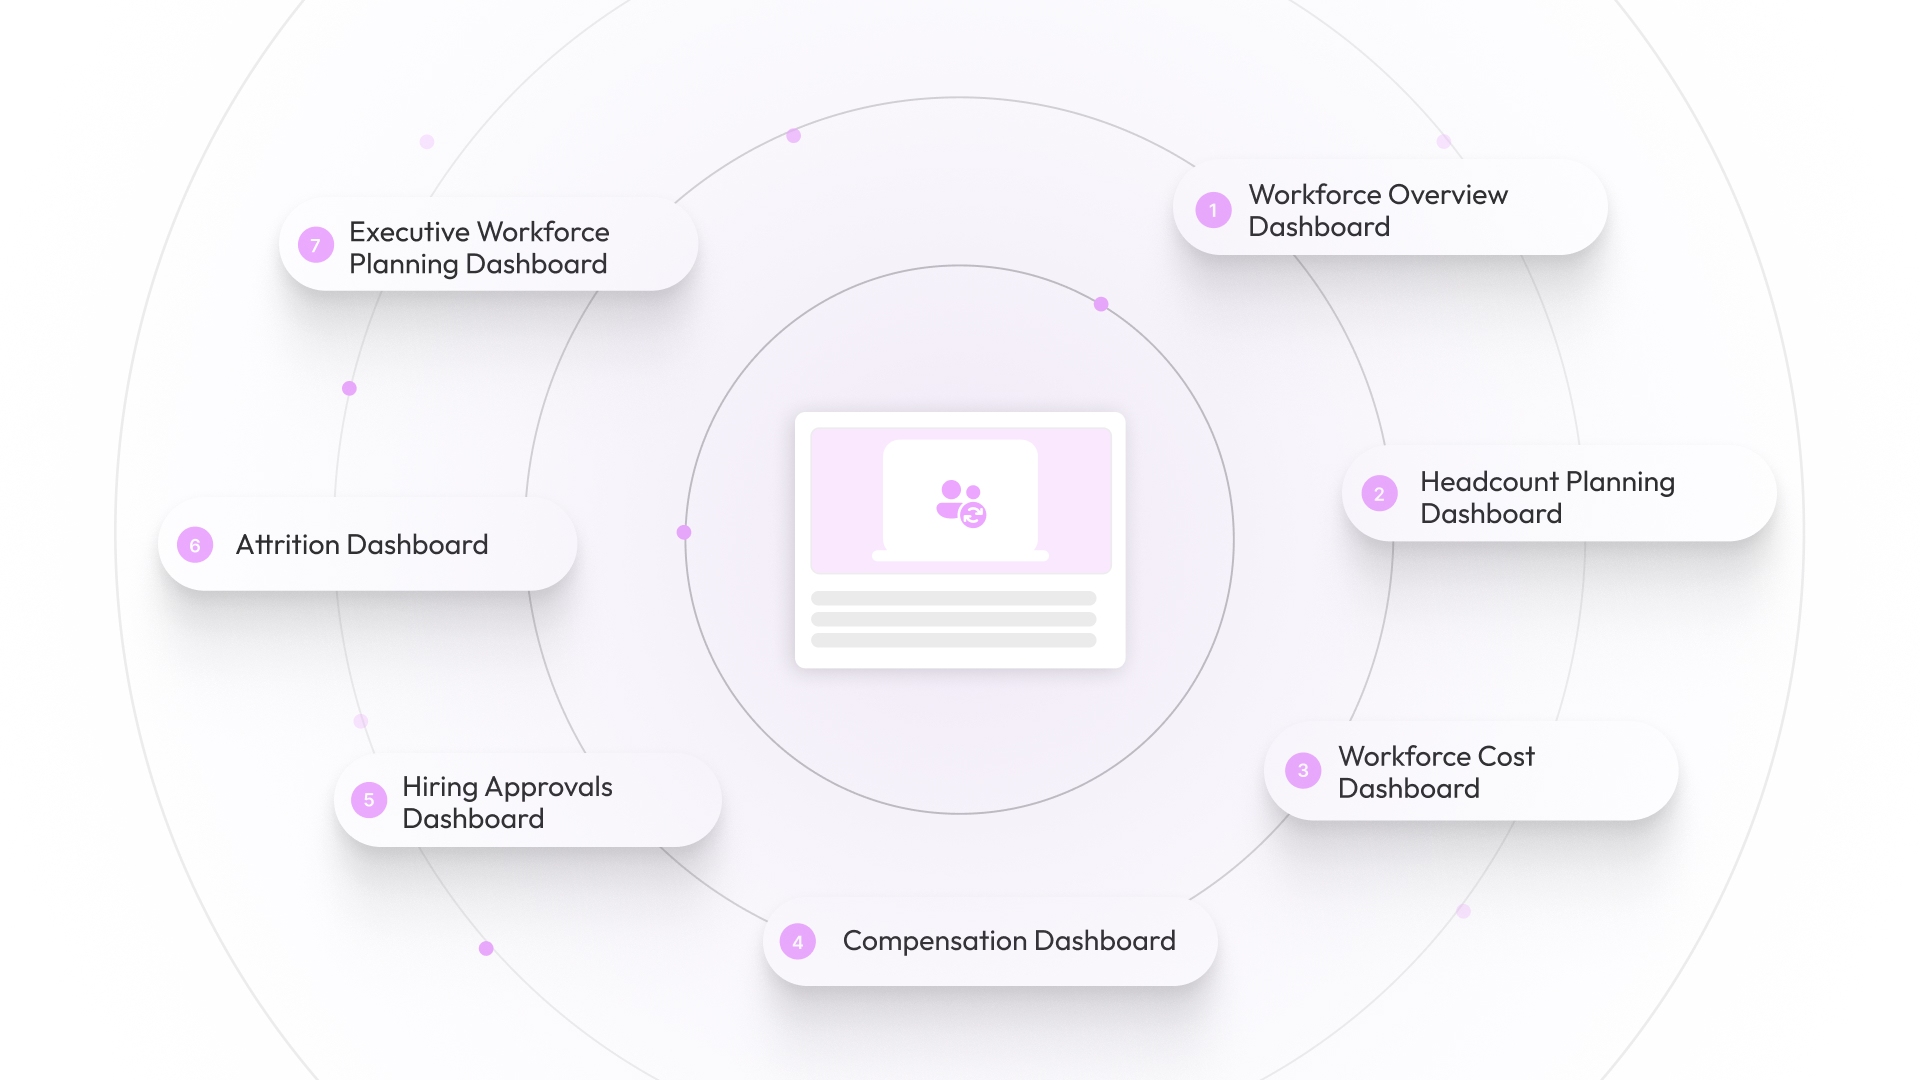
7 Workforce Management Dashboard Examples for Headcount, Hiring, and Workforce Cost
If you are trying to improve workforce planning, the next step is not adding more reports. It is identifying which dashboard views would make your current decisions easier, faster, and more reliable. The examples below are the ones teams usually prioritize when they need better control over headcount, hiring, and workforce cost.
1. Workforce Overview Dashboard
Start here if different teams keep bringing different headcount numbers into the same meeting. This dashboard gives you one shared baseline before planning discussions go off track.
- When to rely on this view: HR, Finance, and team leaders are not working from the same workforce numbers.
- What this view should clarify: A single, accurate picture of headcount, team mix, reporting layers, and open roles without pulling multiple reports.
- Where most setups fall short: Conflicting numbers, outdated org views, or too much manual reconciliation before leadership reviews.
- What a better system enables: One live view everyone trusts during staffing and budget discussions.
For Example, if Finance reports six new Operations hires but HR shows four hires and two internal moves, this dashboard should settle that in minutes.
2. Headcount Planning Dashboard
Move to this view when hiring requests are piling up, and leadership needs to decide what actually moves forward. This is where workforce planning becomes more disciplined.
- When this becomes critical: Teams keep asking for roles, but priorities, budget, and org structure are not clearly aligned.
- What you should be able to do: Compare planned vs actual headcount, evaluate role mix, and identify where hiring plans need to shift.
- What to watch in your current setup: Approved headcount in one place, open roles in another, and no clear view of what changed.
- What strong planning looks like: Immediate visibility into which roles are approved, delayed, or no longer aligned with priorities.
For Example, if a product wants more managers but delivery output is slowing, this dashboard should help you decide whether to add leadership or hire more individual contributors.
3. Workforce Cost Dashboard
This is one of the first dashboards teams need when labor spend starts rising faster than expected. It should help you move from budget pressure to a clearer next action.
- When to prioritize this dashboard: Overtime is increasing, department costs keep missing plan, or labor spend is drifting.
- What decisions it should support: Identifying where cost pressure is building and whether to hire, shift work, or redesign coverage.
- Where gaps usually appear: Labor cost, overtime, and approved headcount are sitting in separate tools with no shared context.
- What an improved setup delivers: A connected view of workforce cost and staffing decisions before overspend shows up in reporting.
For Example, If Support has missed its labor target for three months, this dashboard should help you see whether the issue is understaffing, schedule design, or uncontrolled overtime.
4. Compensation Dashboard
This dashboard becomes a priority when compensation decisions start affecting hiring speed, retention, or workforce cost. It should make pay decisions easier to review in context, not in isolation.
- When this view matters most: Salary decisions become harder to manage across teams, levels, or locations.
- What it should help you understand: Pay patterns, inconsistencies, and how compensation changes affect total workforce cost.
- What to review in your current setup: Pay data that is difficult to compare or disconnected from hiring and planning workflows.
- What a stronger setup allows: Compensation decisions reviewed alongside role level, geography, and workforce planning.
For Example, If one region keeps hiring above range for similar roles, this dashboard should help you decide whether to revisit pay strategy, hiring plans, or both.
5. Hiring Approvals Dashboard
This is the dashboard to prioritize when hiring requests keep stalling or moving without clear accountability. It brings speed and structure to the part of hiring that often gets buried in inboxes and meetings.
- When This Becomes a Bottleneck: Open roles are aging, approvals are slow, or teams lack visibility into request status.
- What it Should Make Visible: Request status, urgency, and where approvals are getting stuck.
- Where Current Workflows Break: Hiring requests are managed through email, spreadsheets, or disconnected systems.
- What a Structured System Enables: Clear ownership, connected approvals, and full budget visibility in one place.
For Example, If a Revenue Operations role has been waiting for approval for weeks, this dashboard should show whether the blocker is budget signoff, unclear ownership, or a broken workflow.
6. Attrition Dashboard
This dashboard matters when turnover stops looking random and starts affecting planning. It helps you move from reactive backfills to earlier intervention.
- Start With This Dashboard If: certain teams keep losing people, backfills are becoming routine, or retention risk is getting harder to explain.
- It Should Make It Easier To: spot where turnover is building and decide whether the response should be hiring, manager support, or compensation review.
- Check Your Current Setup For: turnover being tracked only as a company-wide number with no breakdown by team, tenure, or role type.
- A Stronger Setup Should Let You: catch concentrated attrition earlier and plan responses before critical teams become unstable.
For Example, if the same manager loses three strong performers in one quarter, this dashboard should help you see whether the issue is workload, pay pressure, or team leadership.
7. Executive Workforce Planning Dashboard
This is the view leadership needs when workforce decisions start affecting business direction, not just team staffing. It should help leaders decide where talent and budget should go next.
- When This Becomes Essential: Executives are deciding where to invest, slow down, or shift workforce priorities.
- What it Should Enable: Comparing trade-offs across teams and reallocating headcount based on business impact.
- Where Visibility Often Breaks: Strategy decisions made without a unified view of hiring progress, cost, and capacity.
- What Strong Execution Looks Like: One place to review workforce investment decisions before committing budget.
For Example, if three teams are asking for growth budget but only one is showing strong returns, this dashboard should help leadership decide where added headcount is most likely to pay off.
Once you know which of these dashboards would help most, the next step is simple. Pick the planning problem that is creating the most friction right now, such as slow hiring approvals, weak cost visibility, or unclear headcount planning.
Then check whether your current setup can support that view without manual work, conflicting data, or separate approval trails. If it cannot, that is usually the point where teams start looking for a more connected workforce planning system

How to Choose the Right Dashboard for Your Workforce Planning Needs
The right workforce planning dashboard depends on the decision you need to make most often. Start with the planning problem, such as budget variance, hiring delays, attrition risk, or compensation drift, then choose a dashboard that surfaces that issue quickly, clearly, and with enough detail to support action.
The selection points below help narrow the dashboard type based on the planning problem in front of you.
- Match The Planning Problem: Choose a dashboard based on the exact issue, such as budget overruns, approval delays, hiring gaps, or retention pressure.
- Check Data Readiness: Confirm whether headcount, payroll, hiring, and time data can be pulled into one view without manual reconciliation. If that still depends on spreadsheets or disconnected tools, platforms like CandorIQ can help bring planning, approvals, and workforce spend into one connected system.
- Prioritize Decision Speed: Pick a dashboard that helps managers act during weekly reviews, not one built only for monthly reporting.
- Validate User Fit: Make sure the level of detail matches the user, executive teams need summary views, while People Operations needs workflow depth.
- Test Actionability: Select dashboards that support a next step, such as approving hires, adjusting schedules, or reviewing compensation changes.
A strong dashboard is not the one with the most metrics. It is the one that helps your team make the right workforce decision with less friction.
When dashboard selection starts raising questions around governance, risk, and operational control, the next read is top workforce compliance and optimization tools.
Common Mistakes That Make Workforce Dashboards Hard to Use
Workforce dashboards become hard to use when they mix reporting with planning, rely on delayed data, or bury critical signals under too many disconnected metrics. The result is slower approvals, weaker staffing decisions, and low trust in the dashboard during budget reviews, hiring discussions, and workforce planning conversations.
The table below highlights the mistakes that most often reduce dashboard usability and decision value.
Fixing these dashboard mistakes improves trust, reduces reporting friction, and gives HR and Finance a clearer path to faster, more confident workforce planning decisions.
Many of these dashboard issues connect back to broader talent visibility and planning gaps, which makes top benefits of a talent management system for growing organizations a useful next step.
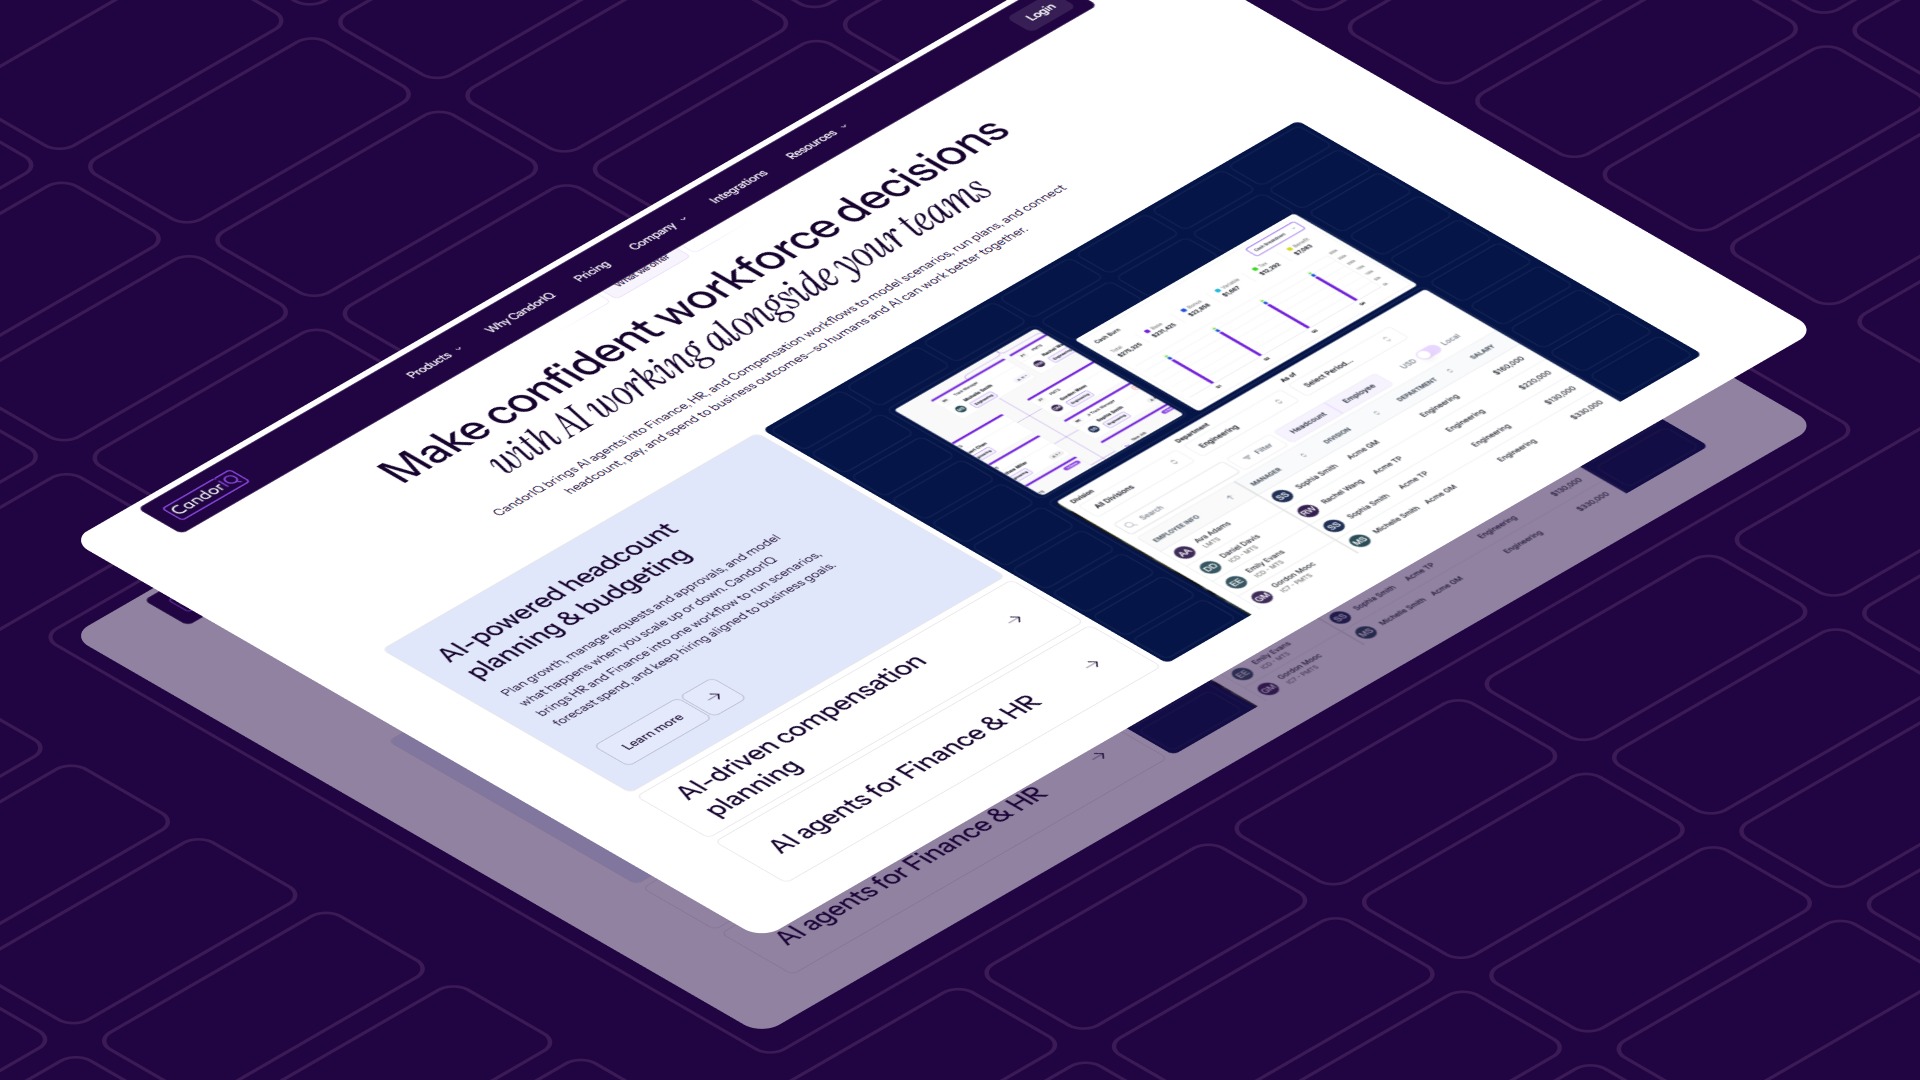
How CandorIQ Helps Teams Turn Workforce Data Into Better Decisions
CandorIQ helps HR and Finance teams move from disconnected workforce data to faster, better planning decisions. It connects headcount, compensation, approvals, and spend in one system, so teams can model scenarios, control budgets, run compensation workflows, and act on workforce changes without relying on spreadsheets or manual coordination.
The products below show how CandorIQ supports specific workforce planning and compensation decisions across Finance, HR, and recruiting workflows.
- Headcount Scenario Planning: Model hiring plans, org changes, and budget impact before approvals, including employees, contractors, and AI teammates. This helps teams test scenarios, understand cost trade-offs, and plan growth without overhiring or budget surprises.
- Headcount Requests & Approvals: Replace scattered approval chains with structured workflows tied to hiring requests, role context, and budget visibility. This reduces delays, removes back-and-forth, and keeps hiring aligned with business priorities.
- Compensation Cycle: Run merit reviews, salary adjustments, and spend tracking in one system with clear budgets and timelines. This helps teams complete cycles faster, reduce inconsistencies, and maintain control over compensation spend.
- Compensation & Payband Builder: Build pay bands, map employees to levels, and compare compensation against market data in one workflow. This helps teams catch pay gaps early and make consistent, defensible pay decisions.
- Workforce Management And AI Agent: Track workforce spend across teams and geographies while AI agents analyse trends, flag risks, and generate reports. This improves visibility, helps catch issues early, and supports faster, data-backed decisions.
.png)
FAQs
1. What should a headcount reporting dashboard include to support workforce planning?
Headcount reporting should show current vs planned headcount, hiring pipeline, and budget impact in one view. It helps teams catch hiring risks early and stay aligned with financial targets.
2. How does an HR KPIs dashboard differ from a workforce planning dashboard?
An HR KPIs dashboard tracks metrics like attrition, performance, and engagement. A workforce planning dashboard connects those metrics to compensation decisions, hiring plans, and budget outcomes.
3. What makes a WFM dashboard useful for real workforce decisions?
A WFM dashboard should link headcount, compensation, and approvals in real time. It becomes useful when teams can act on the data, not only monitor it.
4. How does workforce analytics improve compensation and hiring decisions?
Workforce analytics helps teams evaluate trends such as hiring velocity, pay distribution, and cost impact. This allows HR and Finance to make consistent, data-backed decisions.
5. What is a workforce competency dashboard and when should teams use it?
A workforce competency dashboard tracks skills, role readiness, and performance across teams. It becomes valuable when used to guide promotions, hiring needs, and compensation adjustments.
Ready to modernize your workforce and compensation strategy?
See how CandorIQ brings workforce planning and compensation together with AI.