ONA Data Sources That Actually Drive Workforce Decisions in 2026
Organizational network analysis data sources in 2026 show collaboration patterns. Learn which data supports hiring, compensation, and workforce planning.
.jpg)

Most People Ops teams already have access to collaboration data, Slack activity, meetings, emails, and project tools. The problem is not data availability. It’s knowing what to do with it.
In fact, studies show that 60% of executives still rely on basic productivity metrics like hours worked or emails sent, missing how teams actually collaborate. This creates a gap between data visibility and real workforce decisions.
You can see how teams interact, but that rarely translates into clear hiring plans or compensation decisions. This is where Organizational Network Analysis (ONA) comes in. It helps you understand how work actually happens across your organization through organizational network analysis data.
But not every data source gives you useful insights. And not every insight helps you make a decision.
In this article, you’ll learn which data sources for organization network analysis matter, where they fall short, and how to use them for headcount and compensation planning.
Key Takeaways
- Organizational network analysis data reveals how work flows across teams, including dependencies and coordination load, but does not define performance or pay decisions.
- Passive data shows real collaboration patterns, while active data explains influence, trust, and team dynamics behind those patterns.
- Communication, survey, output, and skills data each inform specific decisions like hiring needs, role value, and workload distribution.
- Misinterpreting connectivity or relying on incomplete data can lead to incorrect hiring plans and compensation misalignment.
- Platforms like CandorIQ connect these insights to structured headcount and pay planning, enabling clearer and more consistent decisions.
What Organizational Network Analysis Actually Tells You (And What It Doesn’t)
Most teams expect Organizational Network Analysis (ONA) to explain performance or productivity. That’s where things start to break.
ONA is not a performance tool. It is a relationship and collaboration visibility layer. It shows how work flows across your organization, not how well individuals perform.
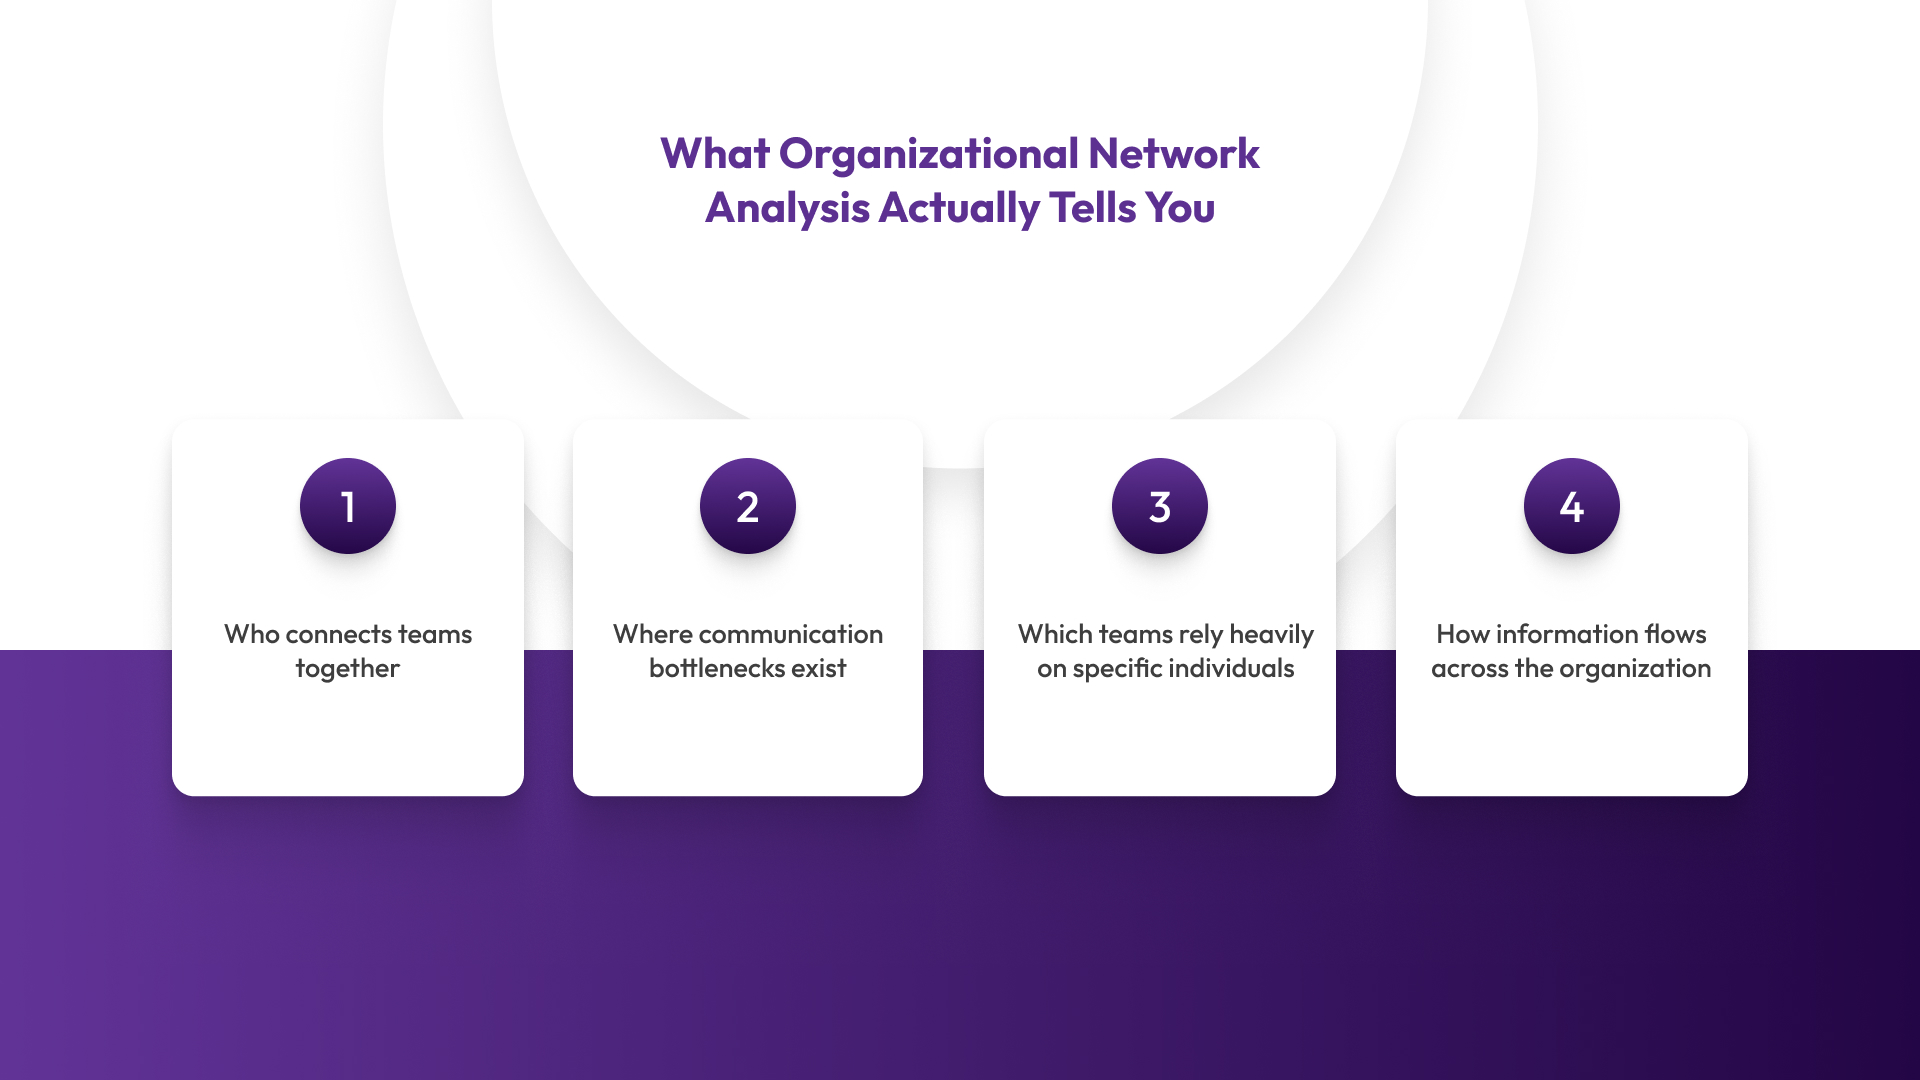
Here’s what ONA actually helps you uncover:
- Who connects teams together: Individuals who act as bridges across departments or functions
- Where communication bottlenecks exist: Points where work slows down due to dependency on specific people
- Which teams rely heavily on specific individuals: Roles that carry hidden workload or coordination responsibility
- How information flows across the organization: Whether collaboration is centralized, fragmented, or well-distributed
These insights are useful because they reveal how work actually happens beyond org charts.
What ONA does NOT tell you
This is where most teams misinterpret the data.
ONA does not measure:
- Individual performance or output quality
- Market value of a role or salary benchmarks
- Whether someone is overpaid or underpaid
- Business impact tied to outcomes or revenue
For example, someone with high Slack activity or meeting participation may appear central to the network. But that does not mean they are contributing the most to business outcomes.
Similarly, a role with fewer visible interactions may still drive critical work behind the scenes.
Why this distinction matters for decisions
ONA gives you signals, not conclusions.
If you rely on it in isolation:
- You may overvalue highly connected roles
- You may miss high-impact contributors with low visibility
- You may misinterpret collaboration as performance
To make reliable workforce decisions, ONA data needs to be combined with:
- role expectations
- performance indicators
- compensation frameworks
Where ONA actually adds value
ONA becomes useful when you use it to:
- Identify hidden dependencies before planning headcount
- Understand workload distribution across teams
- Spot coordination-heavy roles that may need restructuring
- Ask better questions before making hiring or compensation decisions
The real value of ONA is not in giving answers. It’s about improving the quality of decisions you make next.
To use ONA effectively, you need to understand the types of data behind it and how each one shapes your decisions.
Active vs Passive Data - Which One Actually Helps You Make Workforce Decisions?
Most teams rely heavily on one type of data without realizing what they are missing. This creates blind spots in how workforce decisions are made.
ONA data comes from two main sources: active and passive. Each answers a different part of the same question and neither is complete on its own.
These approaches are part of broader organizational network analysis data collection methods used across teams.
1. Active Data (Surveys, Interviews)
Active data is collected directly from employees through structured inputs.
This includes:
- ONA surveys
- Feedback forms
- Interviews and focus groups
What it helps with:
- Understanding trust, influence, and informal leadership
- Identifying collaboration preferences across teams
- Explaining why certain communication patterns exist
- Highlighting friction points that are not visible in tools
Where it falls short:
- Responses may be biased or influenced by perception
- Participation varies across teams and roles
- Data becomes outdated quickly as teams evolve
- Hard to scale consistently in fast-growing organizations
Decision implication: Active data helps explain underlying issues, but it is not reliable enough on its own to justify hiring or compensation decisions.
2. Passive Data (Slack, Email, Calendar)
Passive data is collected automatically from tools your teams already use daily.
This includes:
- Slack and Microsoft Teams activity
- Email communication patterns
- Calendar and meeting data
What it helps with:
- Real-time collaboration patterns across teams
- Workload distribution and meeting intensity
- Cross-functional dependencies and bottlenecks
- How work actually flows across the organization
Where it falls short:
- Lacks context behind interactions
- Cannot measure the quality or impact of work
- Misses informal, offline, or undocumented collaboration
- Can overrepresent highly visible roles
Decision implication: Passive data is useful for identifying patterns, but without context, it can lead to incorrect assumptions about role importance.
What This Means for Workforce Decisions
Active and passive data serve different purposes:
- Active data explains why people collaborate
- Passive data shows how they collaborate
Relying on only one creates gaps:
- Passive-only → visibility without context
- Active-only → context without behavioral proof
To make reliable decisions, both need to be combined and interpreted carefully.
For example:
- High collaboration load (passive data) + team feedback on overload (active data) → clear hiring signal
- Central role in communication (passive) + peer recognition (active) → stronger case for role evaluation
ONA becomes useful only when these signals are connected to structured workforce planning.
Once you understand how these data types complement each other, the next step is identifying which specific sources actually matter for hiring and compensation planning.
Also Read: AI-Powered Strategies for Organizational Network Analysis
Which ONA Data Sources Actually Matter for Workforce Planning
Not every organizational network analysis data source contributes equally to workforce decisions. Most teams collect more data than they use, but still struggle to answer basic questions like:
- Where do we need to hire next?
- Which roles are under pressure?
- Are we compensating the right roles appropriately?
The goal is not to collect more data. It is to focus on data that helps you take action.
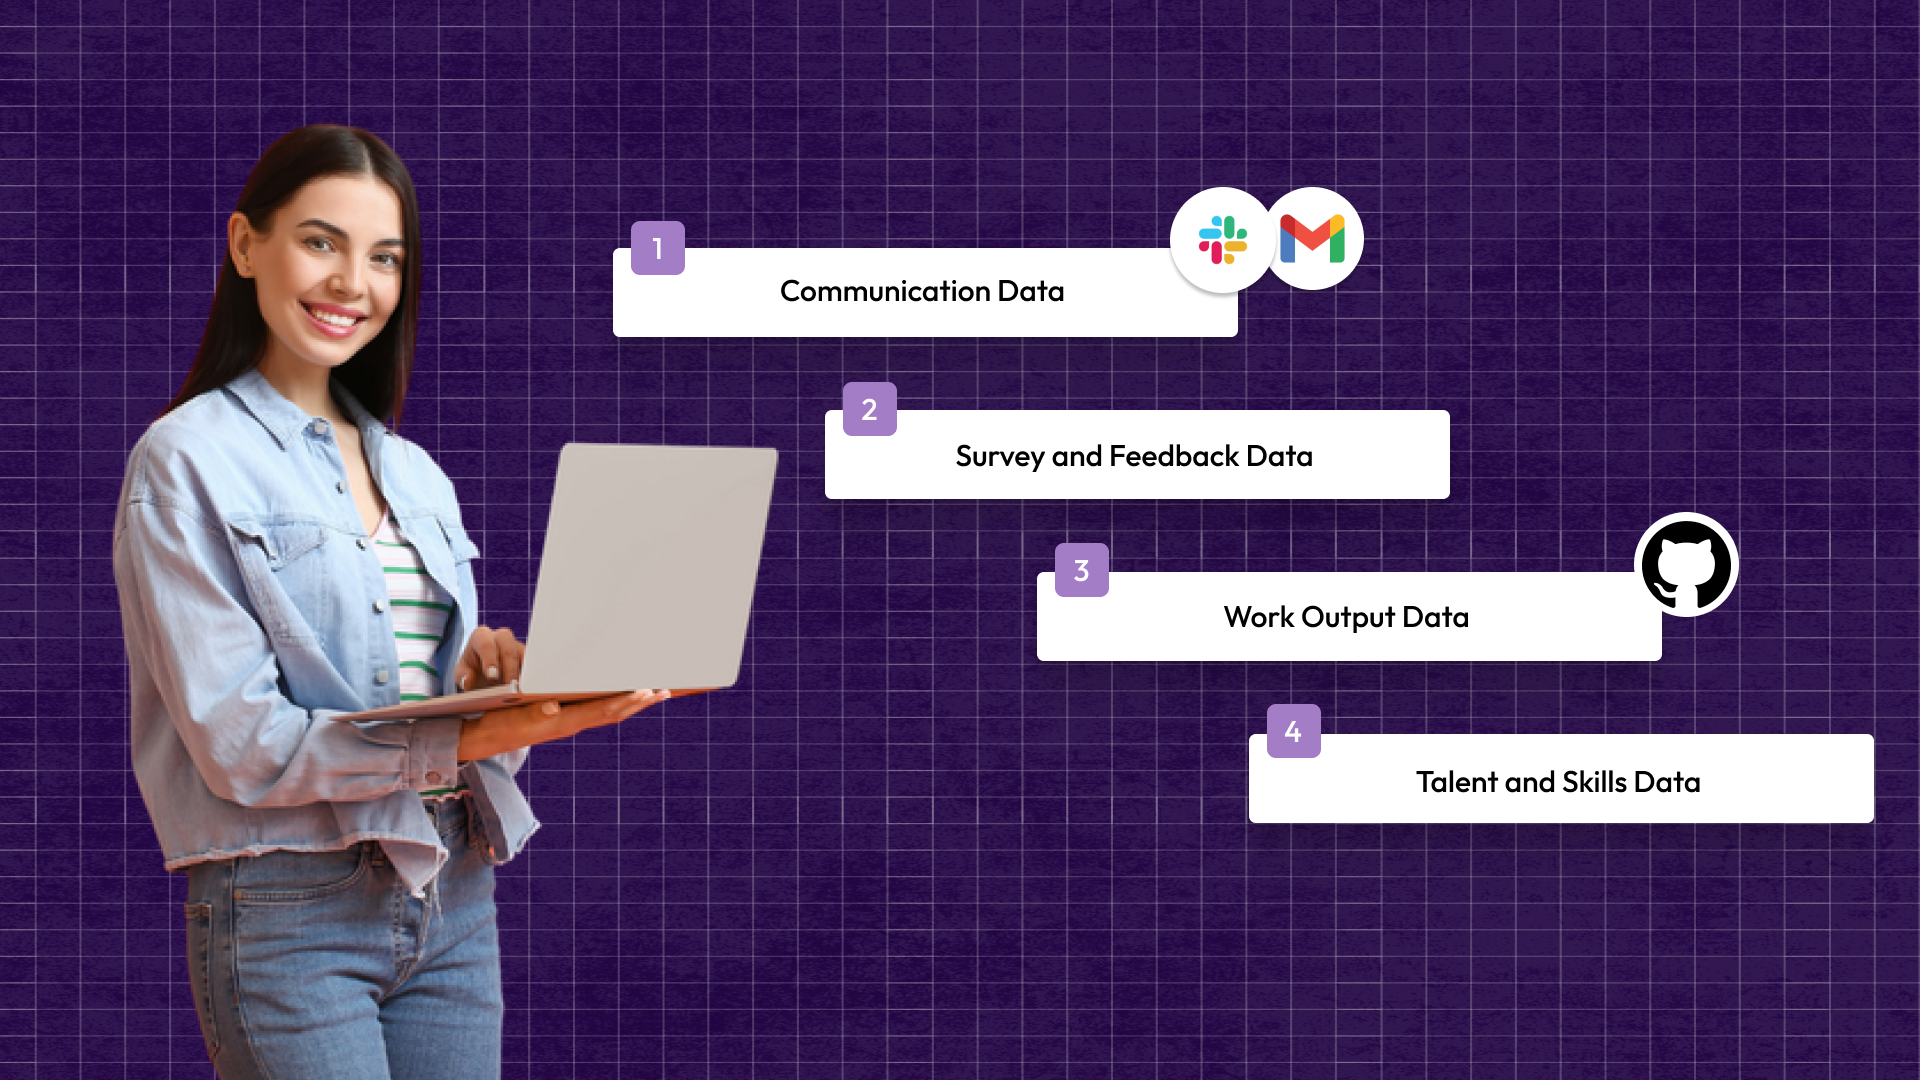
1. Communication Data (Slack, Email, Meetings)
This is the most commonly used ONA data. It reflects how frequently teams interact and where dependencies exist.
What it reveals:
- Overloaded teams involved in multiple workflows
- Cross-functional dependencies that slow execution
- Communication gaps between teams or functions
- Roles that act as coordination hubs across the organization
What it misses:
- Depth and quality of contribution
- Decision ownership and accountability
- Whether interactions actually drive outcomes
Decision use case: If a small team is involved in most cross-team interactions, it often becomes a bottleneck. This can justify additional hiring or redistribution of responsibilities before delays escalate.
What to watch for: High communication volume does not always mean high impact. Some roles naturally require more coordination.
2. Survey and Feedback Data
Surveys add context that passive data cannot capture. They help you understand how collaboration is perceived, not just how often it happens.
What it reveals:
- Perceived influence and informal leadership
- Collaboration quality across teams
- Friction points in workflows
- Trust and reliance between individuals or teams
What it misses:
- Real-time behavior
- Consistency across different teams
- Objective measurement of contribution
Decision use case: If employees consistently rely on specific individuals for clarity or decision-making, those roles may require formal recognition, restructuring, or additional support.
What to watch for: Survey data can be biased. It should validate patterns, not define decisions on its own.
3. Work Output Data (Projects, CRM, GitHub)
This data reflects how work actually gets executed across systems. It connects collaboration to output.
What it reveals:
- Contribution patterns across projects or revenue streams
- Ownership of outcomes and delivery responsibilities
- Execution flow across teams
- Who is consistently involved in critical work
What it misses:
- Informal collaboration and support roles
- Influence outside of tracked systems
Decision use case: Roles contributing heavily to revenue, delivery, or execution can inform compensation calibration when combined with structured pay frameworks.
What to watch for: Not all contributions are captured in systems. Some high-impact roles operate outside formal tracking.
4. Talent and Skills Data
Skills data provides a view of capability distribution across the organization.
What it reveals:
- Skill gaps across teams or functions
- Role dependencies on specific expertise
- Internal mobility opportunities
- Workforce readiness for new initiatives
What it misses:
- How those skills are applied in real collaboration
- Whether skills translate into actual outcomes
Decision use case: If critical skills are concentrated in a few individuals, it creates risk. Hiring plans can focus on reducing dependency and improving resilience.
What to watch for: Skills data shows potential, not performance. It needs to be combined with output and collaboration data.
Bringing It Together
Each data source answers a different question:
- Communication data → Where work flows
- Survey data → How collaboration is experienced
- Work output data → What actually gets delivered
- Skills data → What the organization is capable of
Individually, they provide partial visibility. Together, they create a more complete picture for workforce decisions.
The key is not to treat them equally, but to combine them based on the decision you need to make.
Even with the right data sources in place, ONA has limitations that can impact decision-making if they are not clearly understood.
Where ONA Data Falls Short in Real Decision-Making
ONA data is often treated as a complete source of truth. It isn’t.
Without the right context, it can lead to misleading conclusions and weak workforce decisions. The gap is not data, it’s how that data is interpreted and applied.
Common limitations:
- Missing business context: High collaboration does not always translate to high impact or revenue contribution
- Survey bias: Employees may over-report trusted connections or under-report weak relationships
- Incomplete data coverage: Not all collaboration happens in tracked tools like Slack, email, or meetings
- Misinterpreting connectivity: Highly connected individuals are not always the most valuable contributors
- No compensation structure insight: ONA does not define pay bands, salary benchmarks, or role valuation
This is where many teams struggle. They have visibility into collaboration, but no structured way to act on it.
ONA supports decisions. It does not replace planning systems.
Most teams can see workforce patterns, but still lack clarity on what to do next. Platforms like CandorIQ help turn these insights into structured hiring and compensation decisions, connecting workforce data directly to planning workflows.
To make ONA useful, it needs to connect directly to hiring and compensation decisions.

How ONA Data Actually Supports Headcount and Compensation Decisions
ONA becomes useful only when you connect it to workforce planning workflows.
Here’s how People Ops teams can apply it:
ONA becomes useful only when you connect it to workforce planning workflows. Here’s how People Ops teams apply it:
- Identify bottlenecks to justify hiring: Individuals central to multiple workflows signal dependency risk and need for additional headcount.
- Detect overburdened teams to prioritize hiring: High meeting load and collaboration density indicate resource gaps and unsustainable workloads.
- Map collaboration gaps to adjust team structure: Weak cross-team connections highlight misalignment and need for role redistribution.
- Understand influence patterns to inform role value: Connector roles improve coordination and may require compensation alignment based on impact.
- Combine with benchmarks to support compensation decisions: ONA insights must align with market data and pay bands for consistency and fairness.
- Track workload distribution to prevent burnout-driven attrition: Uneven collaboration patterns indicate teams at risk of overload and performance decline.
Example:
A team heavily involved in cross-functional coordination shows a high collaboration load. Hiring an additional role reduces dependency and improves delivery speed.
To operationalize these insights, teams need a system that connects workforce data with structured planning workflows.
Also Read: 10 Best Compensation Cycle Management Platforms for Scaling HR Teams in 2026
How CandorIQ Connects Workforce Data to Real Decisions
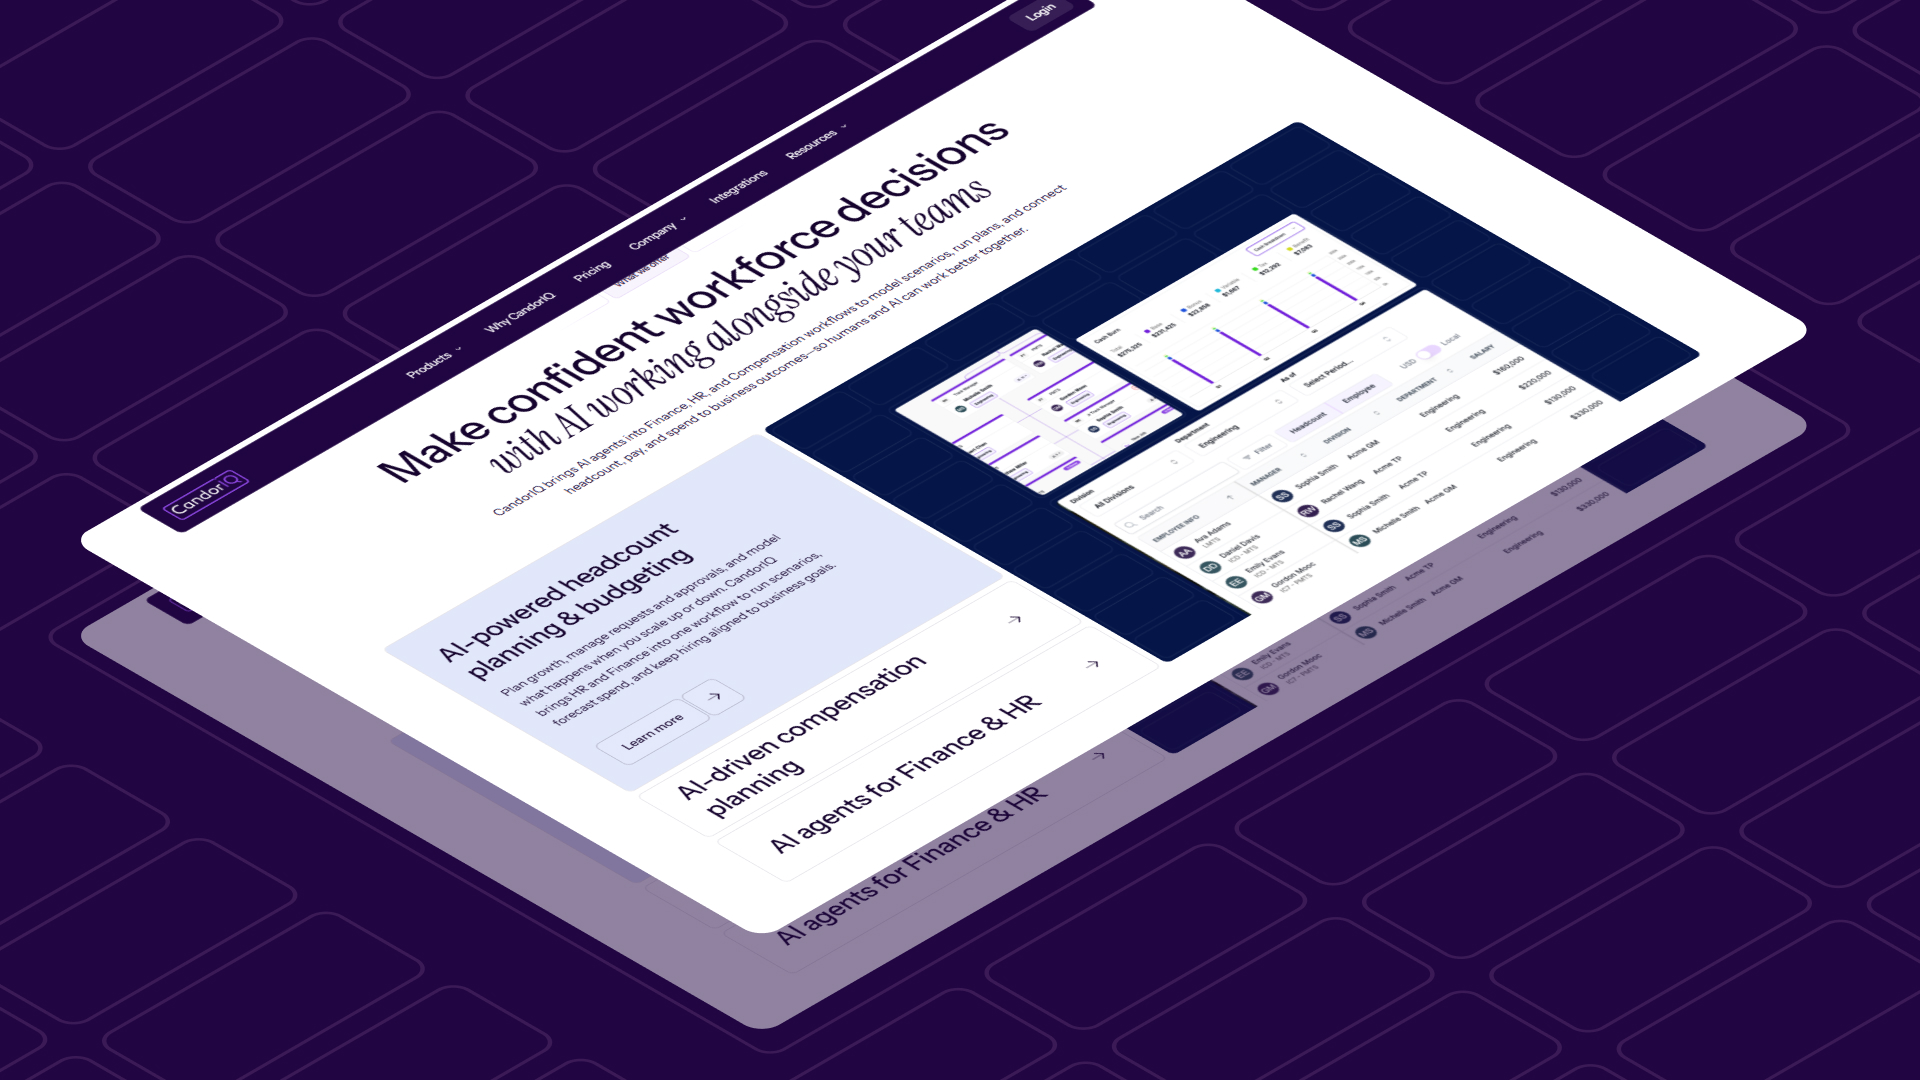
CandorIQ is a compensation and headcount planning platform built for HR and Finance teams. It helps structure pay decisions, manage compensation cycles, and model hiring plans in one system. By replacing spreadsheets, it brings clarity and alignment to workforce decisions.
To move from insight to action, teams need a system that connects workforce data directly to planning workflows.
- Compensation & Payband Builder: Define pay ranges by role, level, and location to standardize compensation decisions
- Compensation Cycle Management: Manage raises, bonuses, and approvals with visibility into budget impact
- Headcount Planning: Model hiring scenarios and understand cost implications before approvals
- Workforce Management: Track actual vs planned headcount and compensation across teams
- AI Agent: Analyze workforce data and surface insights for planning and decision support
CandorIQ helps teams move from fragmented data to structured workforce decisions. It brings compensation and headcount planning into a single, aligned workflow.
Before relying on ONA insights, it’s important to assess how effectively your data supports decision-making.
The next step is understanding how to evaluate its usefulness for workforce planning.
How to Evaluate Whether Your ONA Data Is Actually Useful
ONA data is valuable only when it helps you make clearer workforce decisions. Many teams have visibility into collaboration patterns but lack a way to assess if that data is actionable.
To move from insight to decision, you need a simple way to evaluate how useful your data actually is.
Practical checklist to evaluate your ONA data:
- Check if it supports hiring decisions: Can the data clearly indicate where additional headcount is required or where bottlenecks exist?
- Check if it informs compensation decisions: Does it help explain role impact or highlight areas where pay alignment may need review?
- Check for completeness across teams: Is the data consistent across departments, or are there gaps in visibility?
- Check if it connects to business outcomes: Can you relate collaboration patterns to delivery speed, revenue, or team performance?
- Check for context alongside behavior: Are you combining passive data with survey or feedback insights for better interpretation?
- Check how frequently the data updates: Is the data current enough to reflect ongoing changes in team structure and workload?
- Check if it integrates with planning workflows: Can the data be used directly in headcount planning or compensation cycles alongside existing organizational network analysis tools?

FAQs
1. What are the ethical considerations when using ONA data?
ONA involves analyzing employee interactions, so privacy and consent are important. Data should be anonymized and used at an aggregate level. Clear communication helps build trust and reduces resistance.
2. How can Organizational Network Analysis be implemented effectively?
Start with a clear objective, such as improving collaboration or planning headcount. Combine active and passive data for better accuracy. Focus on actionable insights instead of collecting excessive data.
3. What are some practical applications of ONA in organizations?
ONA can help identify collaboration bottlenecks, improve team structures, and support hiring decisions. It is also used to understand informal leadership and communication gaps. These insights help teams improve execution and coordination.
4. What are common challenges in ONA implementation?
Challenges include incomplete data, misinterpretation of insights, and resistance from employees. Many teams struggle to connect data with actual decisions. Without structured workflows, insights often remain unused.
5. What are the best practices for using ONA effectively?
Use multiple data sources instead of relying on one type. Combine insights with business context before making decisions. Focus on decisions like hiring and role design rather than just analysis.
Ready to modernize your workforce and compensation strategy?
See how CandorIQ brings workforce planning and compensation together with AI.