How to Forecast Stock-Based Compensation Effectively
Master how to forecast stock based compensation with precise assumptions, data accuracy, and automated solutions. Enhance your planning now!

Your VP of Sales needs 15 new reps next quarter instead of 8. Your recruiter is about to close an engineering director with a $300K equity package. And now, your CFO needs next year’s stock-based compensation (SBC) forecast by Friday. Sound familiar?
SBC can be one of the trickiest expenses to forecast, yet it’s crucial for your financial planning. For growth-stage companies, SBC can account for 10-20% of operating expenses, directly impacting EBITDA, burn rate, and unit economics.
The catch? Most finance and HR teams treat SBC forecasting as an afterthought, relying on rough percentage-based estimates. When hiring plans shift, these models fall apart. For example, when revenue grows 3x but headcount grows 4x, those simple models miss the mark.
This guide provides a straightforward, step-by-step framework for forecasting SBC that actually works. It scales with your company’s growth, adapts to hiring changes, and gives leadership the visibility needed to make confident decisions.
At a glance
- SBC Impact: SBC accounts for 10-20% of expenses, affecting EBITDA, burn rate, and board discussions. Forecasting errors can cause large swings.
- Forecasting Complexity: Forecasting involves three variables: grant values, vesting schedules, and turnover. Missing any can cause a 15-20% forecast variation.
- 5-Step Framework: Collect baseline data, align headcount plans with realistic hiring velocity, set equity bands, create a scenario model, and repeat quarterly for ±10% accuracy.
- Common Mistakes: Errors include ignoring refresh grants, overlooking 409A increases, mishandling turnover by department, and not collaborating with People Ops.
- Automation Advantage: Modern platforms automate SBC forecasting, replacing manual work with real-time visibility and AI-powered insights to prevent P&L risks.
What Is Stock-Based Compensation Forecasting? And Why It Matters
Stock-based compensation (SBC) forecasting is about predicting the expense, cash tax impact, and dilution effects of equity grants you'll offer to employees. Unlike salary forecasts, SBC is more complex, as you're forecasting three moving pieces at once.
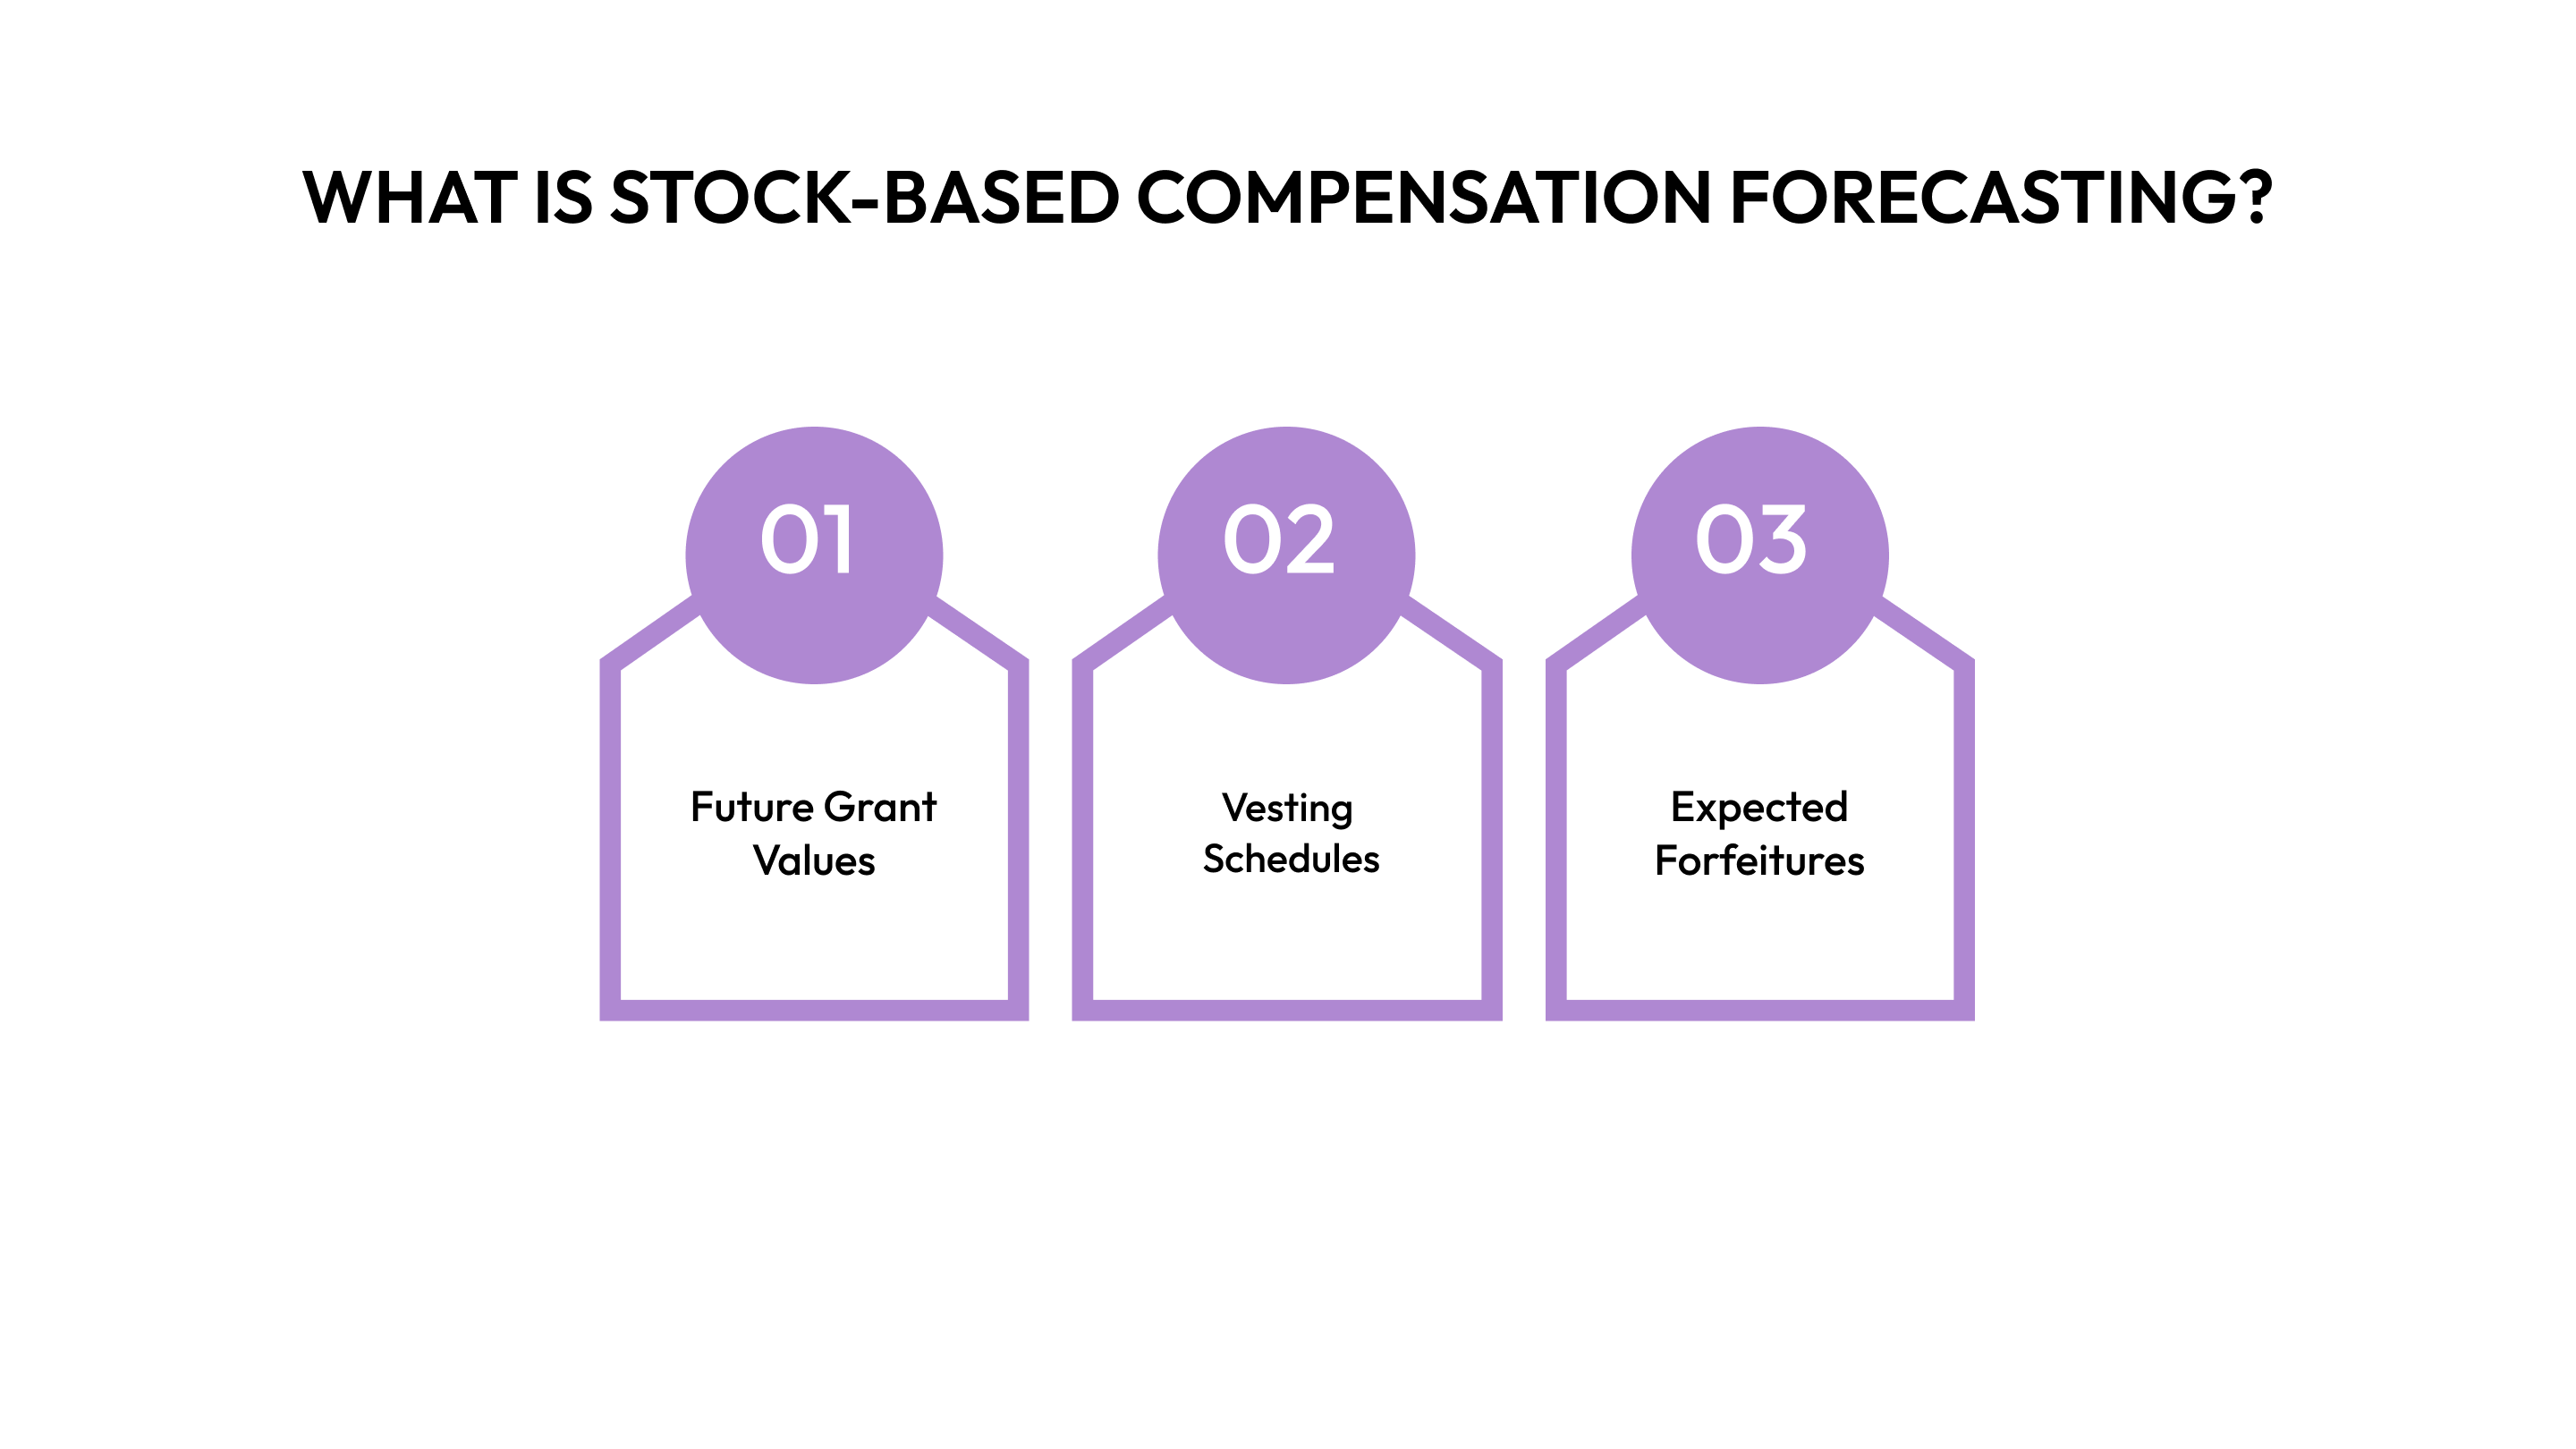
The Three Core Components of an SBC Forecast are:
- Future Grant Values: This is the equity you plan to give employees, considering new hires, promotions, and refresh grants for long-term employees. It’s based on your hiring plan and compensation structure.
- Vesting Schedules: This determines when the SBC expense hits your profit and loss (P&L) statement. Since most equity vests over four years, the expense is spread monthly.
- Expected Forfeitures: This accounts for turnover. If employees leave before their equity fully vests, you reverse the unamortized expense. Incorrect assumptions about turnover can cause big swings in your forecast.
Why "Just Forecast It as % of Revenue" Doesn’t Work for Growing Companies
Many finance teams start with a simple rule: "SBC has been 2% of revenue, so let's keep it that way." But this model quickly breaks down for several reasons:
- Revenue and Headcount Don’t Match: Your revenue may grow threefold, but headcount could grow even faster, especially with new departments or markets.
- Hiring Timing Impacts Expense: If you hire 30 engineers in one quarter instead of spreading them across the year, it will spike SBC expenses for that quarter, something a simple revenue-based model won’t capture.
- Early-Stage Grants Have Higher Equity Value: Your first 50 employees might get larger equity grants compared to later employees. Simple models miss this change.
- Refresh Grants Create Unpredictable Spikes: Refreshing 40% of your engineering team in one quarter can cause a spike in SBC, unrelated to revenue.
This is where modern compensation platforms make a real difference. Compensation management software integrates with your existing HR and finance stack, automatically tracking grants, vesting schedules, and headcount changes in real-time—eliminating the guesswork that comes with spreadsheet-based forecasting.
What You’re Actually Forecasting?
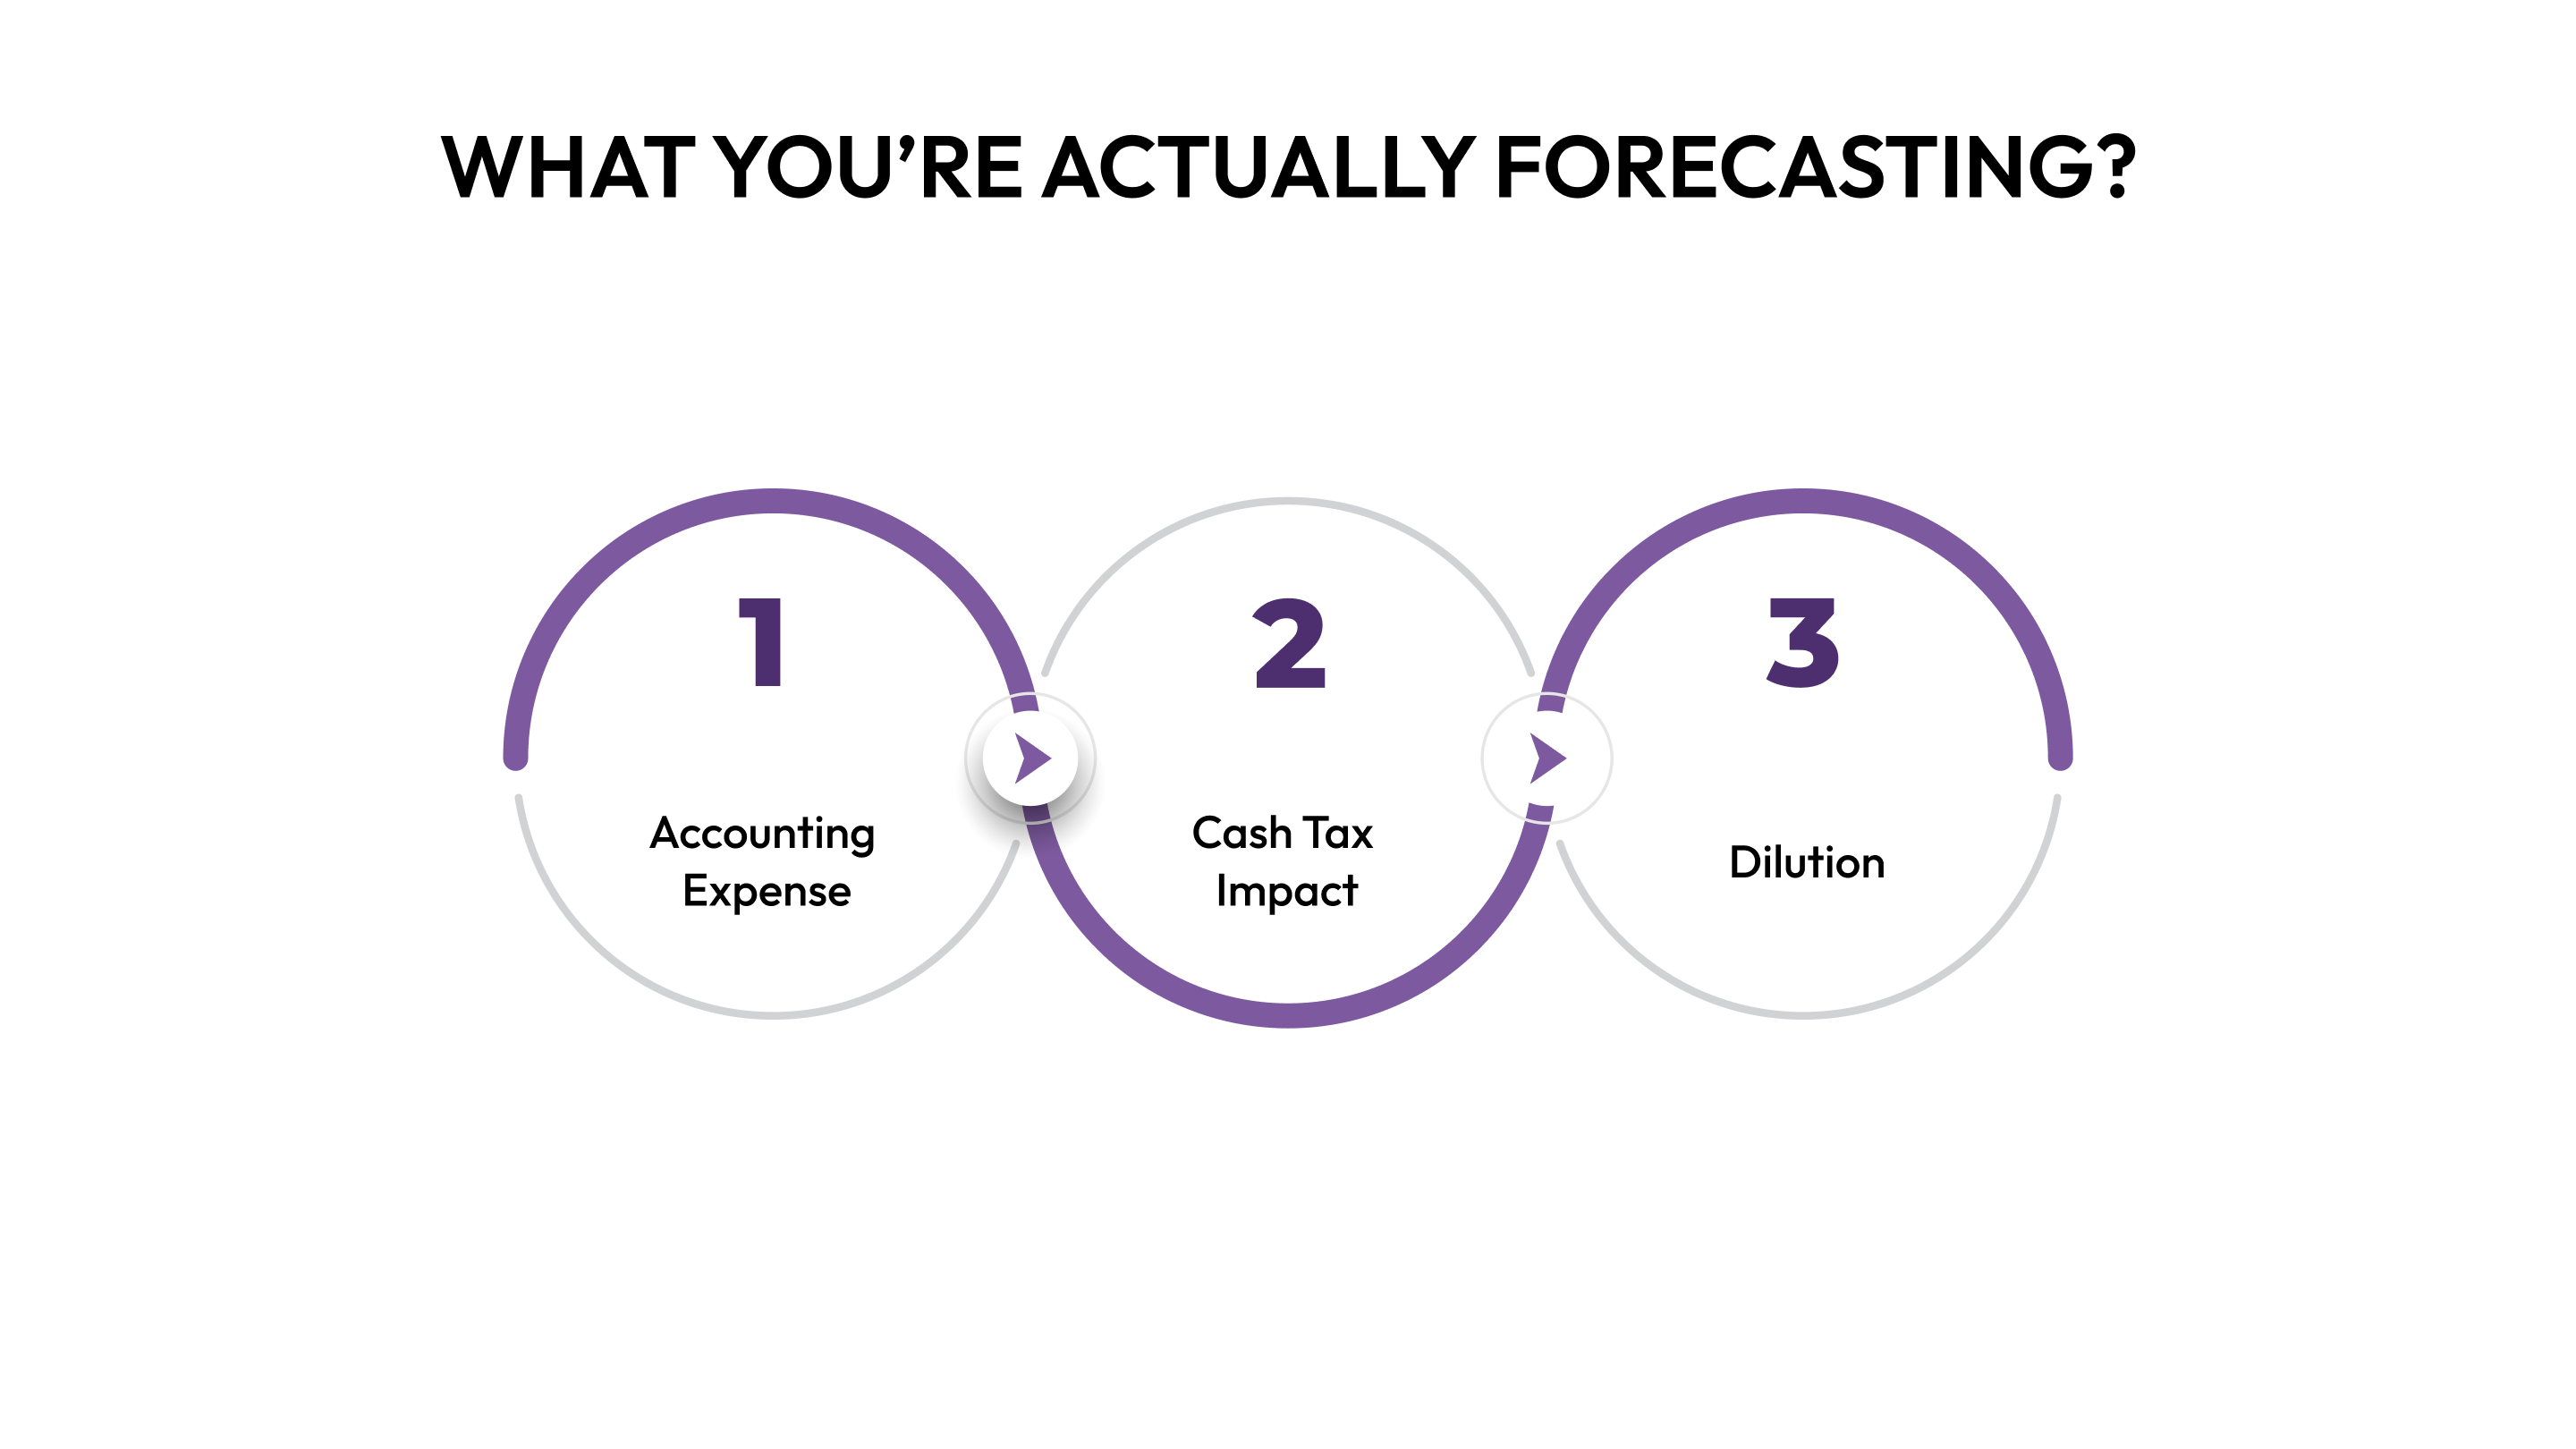
Most companies focus on one figure, but you should track three:
- Accounting Expense: This hits your P&L monthly or quarterly, based on the fair value of grants amortized over the vesting period. It’s a non-cash expense that impacts EBITDA and key metrics.
- Cash Tax Impact: This represents tax deductions when options are exercised or RSUs vest. Unlike the P&L expense, it happens years later when employees exercise options.
- Dilution: This shows the impact of SBC on your fully-diluted share count. It matters for ownership calculations and investor projections.
Focus first on accounting expense, as it directly impacts your EBITDA and unit economics. You can address dilution later.

SBC Forecasting vs. Equity Budget Management
While they sound similar, these two processes serve different needs:
- SBC Forecasting: Focuses on predicting the expense that hits your P&L. It’s about understanding how SBC affects your financials—burn rate, EBITDA, and budget accuracy.
- Equity Budget Management: This is an HR-driven process that tracks how much of your option pool you can grant. It ensures you have enough equity to support future hiring.
Why both matter: You may have plenty of equity in your pool, but still face unexpected P&L expenses if you granted higher-value options. Your equity budget tells you what you can grant, while your SBC forecast shows how those grants impact your finances.
How They Connect: Review your equity budget and SBC forecast together. The equity budget sets limits on what you can grant, and the SBC forecast tells you how those grants will affect your financials. Keep them aligned to ensure smooth forecasting.
With that foundation in place, let's move into the practical work of building your forecast.
How to Build Your Stock-Based Compensation Forecast: A 5-Step Process
Forecasting stock-based compensation (SBC) can be a daunting task, especially in fast-growing companies where hiring plans change rapidly. But getting it right is essential for financial planning. SBC impacts everything from your burn rate to EBITDA and unit economics.
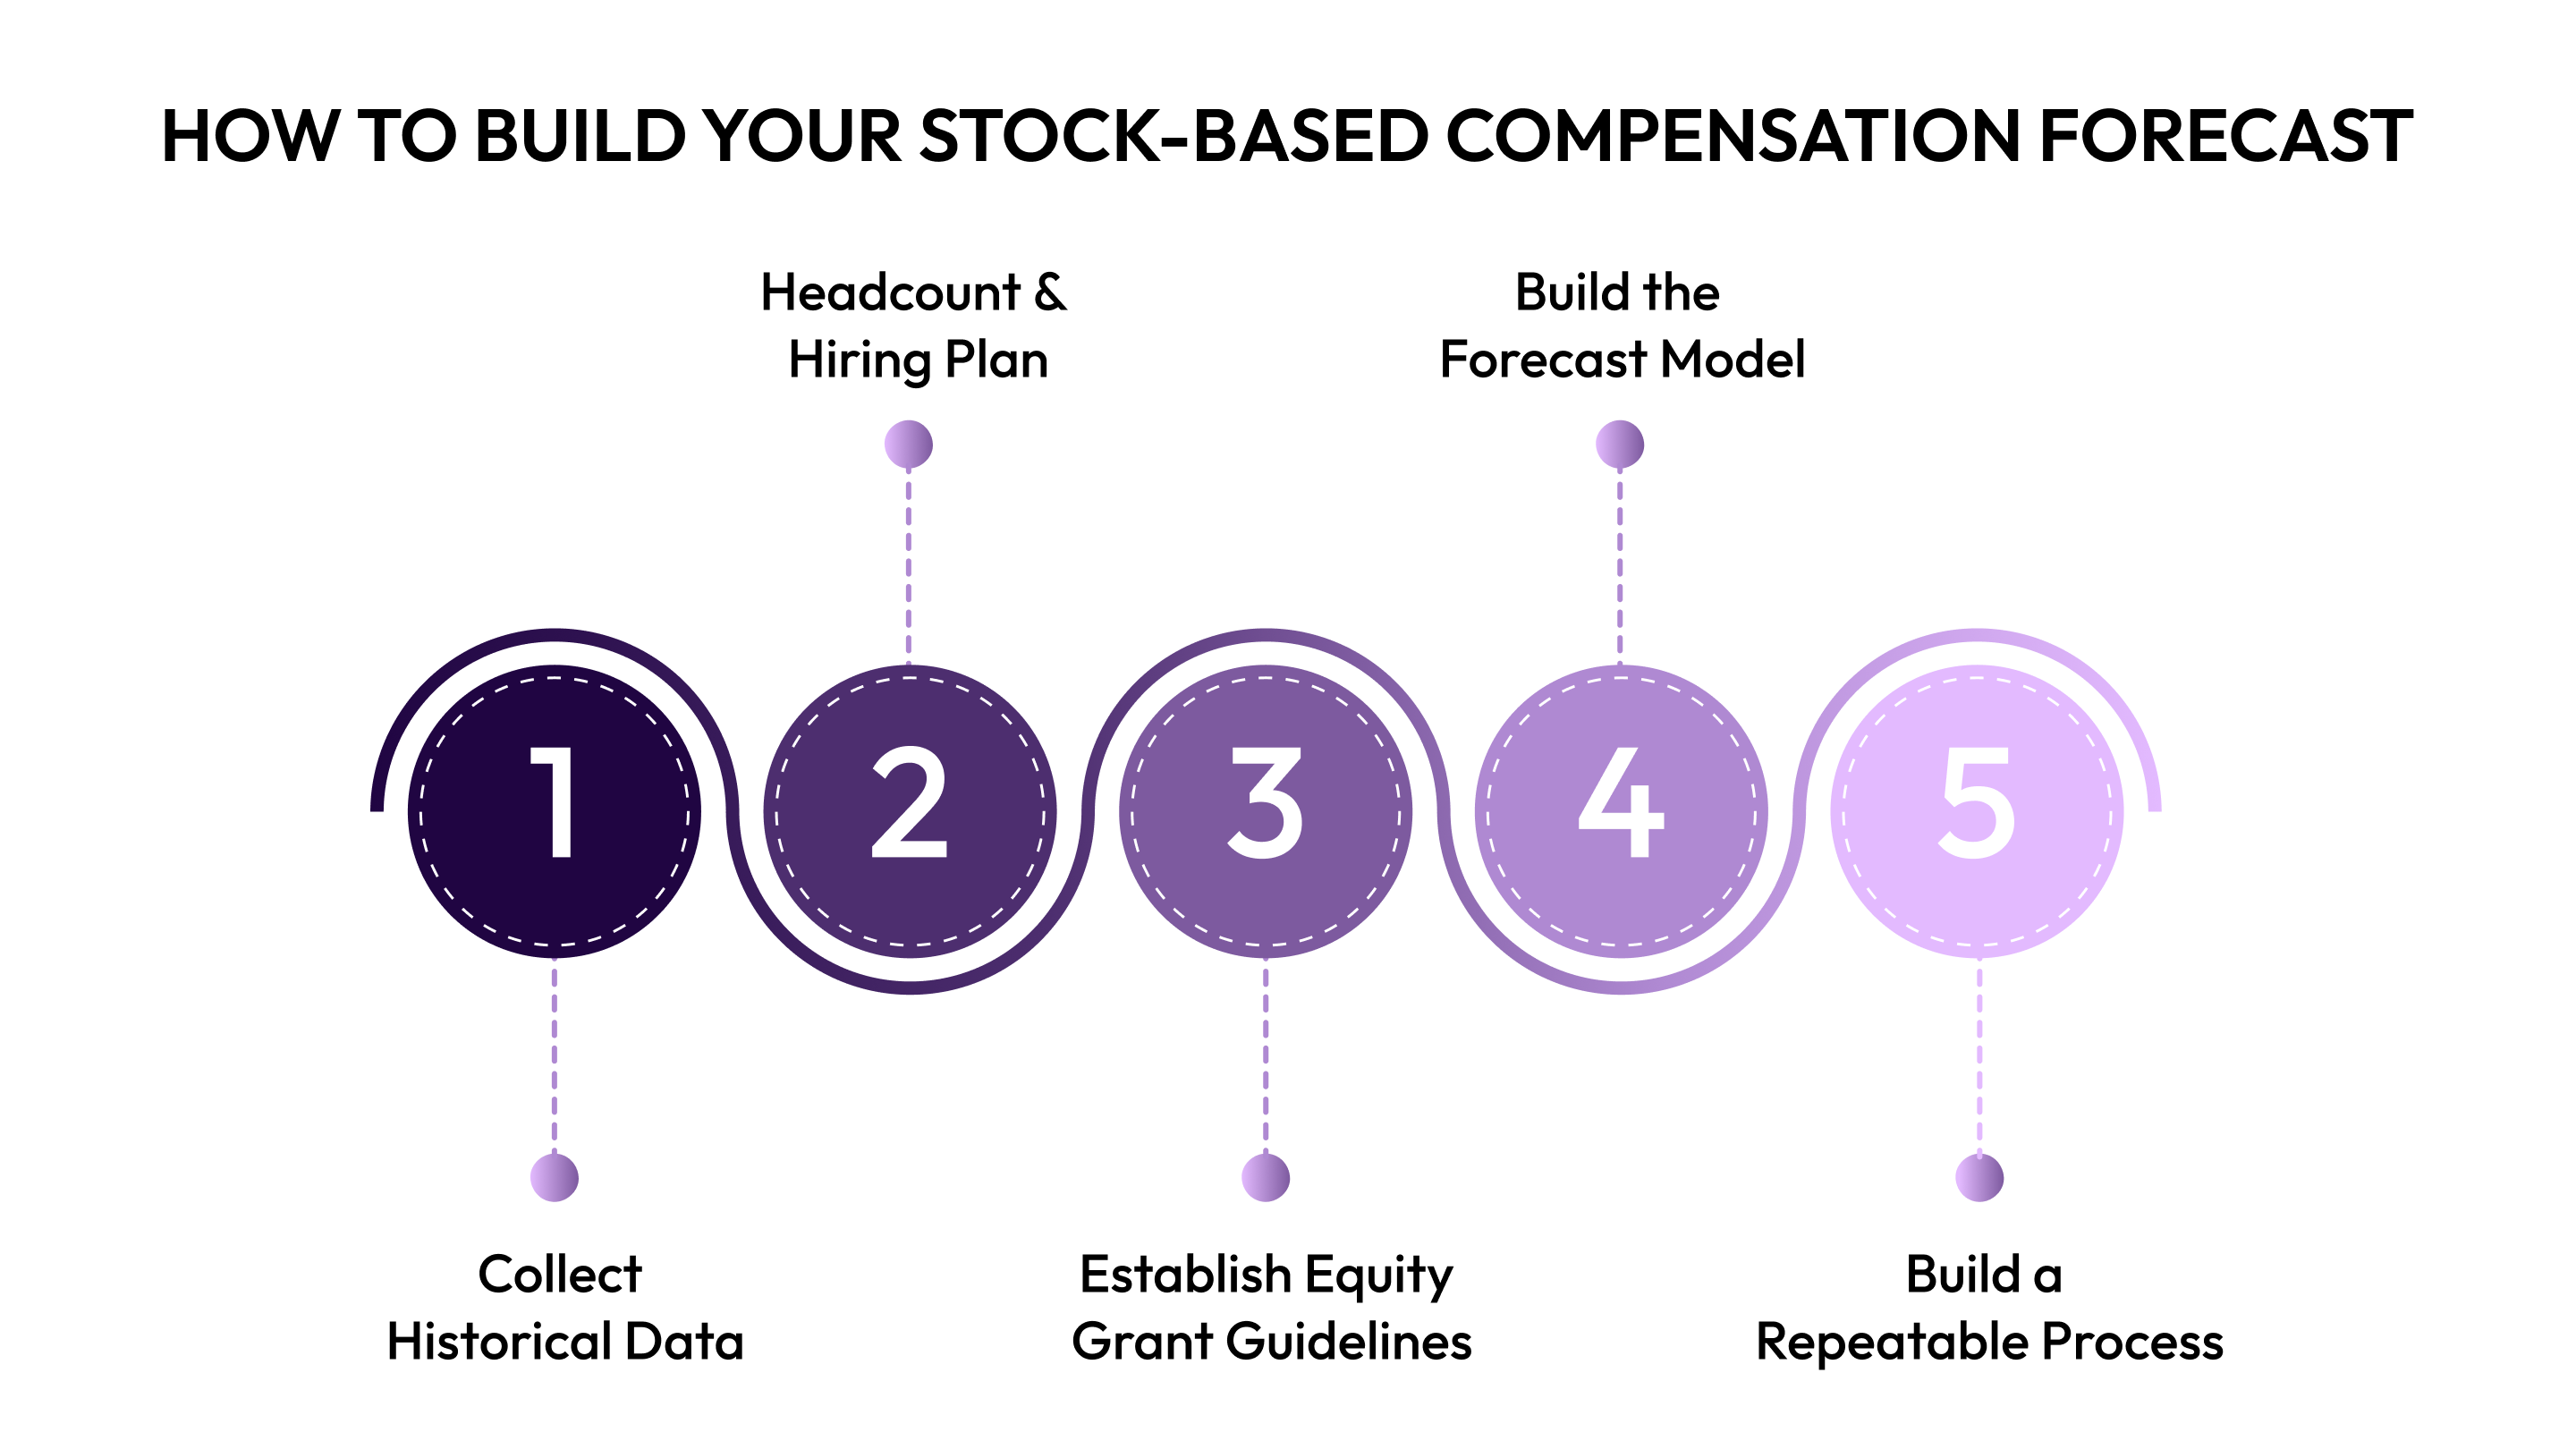
Here is the step-by-step process:
Step 1: Collect Historical Data and Current State Information
Before forecasting, you need a clear picture of your current SBC position. Here’s what you’ll need:
- From Your Cap Table Software: Pull all outstanding grants (options, RSUs, PSUs) with details like grant dates, strike prices, vesting schedules, and fair market value (409A valuation).
- From Your HRIS/Payroll System: Export current headcount, hire dates, and department information.
- From Your Finance/Accounting System: Gather historical SBC expenses and unamortized SBC balances.
Common Data Challenges:
- If grant-date fair values are missing, use 409A valuations or estimates.
- Standardize vesting schedules using templates.
- Allocate employees across departments based on primary cost centers.
Success Metric: You should be able to answer: "How much SBC expense will hit the P&L in the next 12-24 months?"
Many teams struggle with this data collection phase because information lives in multiple disconnected systems. Modern platforms like CandorIQ automatically integrate with your cap table, HRIS, and finance systems, creating a single source of truth for all compensation data—saving hours of manual reconciliation work.
Step 2: Create Your Headcount and Hiring Plan
Your SBC forecast depends on your headcount forecast. Ensure it’s as accurate as possible.
- Job Level Distribution: Senior roles get more equity. Adjust for seniority mix.
- Hiring Timing Assumptions: When will hires occur? Will they be spread evenly or in cohorts?
- Turnover Expectations: Departments like Sales may have higher turnover, which affects forfeiture assumptions.
Collaboration Checkpoint: Meet with the CFO, People Ops, and Recruiting to align hiring plans with realistic velocity and candidate pipelines.
Success Metric: Hiring managers and Recruiting agree on realistic headcount and timing.
Suppose you're managing distributed teams across multiple geographies. In that case, geographic pay strategies will significantly impact your SBC forecast. Different locations mean different fair market values, which directly affect grant sizes and overall expenses.
Step 3: Establish Equity Grant Guidelines by Role and Level
To avoid guesswork, set clear equity bands for each role and level.
- Build Equity Bands: Create a matrix that defines grant ranges by department and level. For example, Senior Engineers might get 15,000-25,000 options.
- Department-Specific Considerations: Sales equity is typically lower, with more focus on commissions, while Engineering often receives higher equity grants.
- Refresh Grants: Define eligibility and grant size, typically 30-50% of the original grant value, after 2-3 years.
Companies like KRAFTON Americas have transformed their compensation decision-making by building structured job architecture and pay bands. Instead of spending hours on each compensation decision, their Head of People now makes informed decisions in minutes using real-time benchmarking data.
Success Metric: 80% of offers should fall within the defined equity bands.
Step 4: Build the Forecast Model
Now, build your forecast using a clear structure.
- Basic Formula:
SBC Expense = Unvested Existing Grants + New Hire Grants + Refresh Grants - Forfeitures.
- Model Structure:
- TAB 1: Existing Grants – Import and calculate amortization.
- TAB 2: New Hire Grants – Apply grant values from your headcount forecast.
- TAB 3: Refresh Grants – Apply your refresh policy and calculate fair values.
- TAB 4: Forfeitures – Apply turnover assumptions and reverse unamortized expense.
- TAB 5: Consolidated Forecast – Combine all tabs into a single view.
Best Practice: Run three scenarios (Conservative, Moderate, Aggressive) and present the moderate case.
Common Modeling Mistakes:
- Timing: Don’t forget to account for mid-quarter grants.
- 409A Assumptions: Escalate 409A valuations by 15-30% for future grants.
- Refresh Grants: Always include refreshes for 30-50% of employees.
- Forfeitures: Use department-specific turnover rates.
Success Metric: Your forecast should align with actuals within 10% by the second quarter.
This is where AI-powered compensation tools can dramatically reduce manual work. AI analyzes patterns in your historical data, automatically adjusts for market trends, and flags potential risks, like upcoming refresh grant cycles or higher-than-expected turnover rates, before they impact your forecast.
Step 5: Build a Repeatable Process and Governance Framework
A good forecasting process needs clear ownership and regular updates.
- Ownership Matrix: Assign responsibilities for updating forecasts, hiring assumptions, and grant values.
- Quarterly Planning Process:
- Week 1: Collect data from all systems.
- Week 2: Analyze variances and update assumptions.
- Week 3: Rebuild the forecast with updated assumptions.
- Week 4: Review with Finance and People Ops, and present to leadership.
Success Metric: Keep variance within ±10% by your second quarter and refine to ±5% by your fourth.
When your compensation data lives in a unified platform like CandorIQ that integrates with your entire HR and finance stack, updating your forecast becomes a matter of refreshing data rather than rebuilding spreadsheets from scratch.
By following these steps, you’ll create a forecast that adapts to changes and provides leadership with the visibility they need for confident decision-making. Keep the process agile and make adjustments as you go.
But even with a solid process, there are still pitfalls to avoid. Let's look at the most common mistakes that trip up even experienced teams
7 SBC Forecasting Mistakes And How to Fix Them

Even the best forecasting frameworks fall apart when common mistakes creep in. As hiring plans change, new grants are issued, and valuation assumptions shift, it's common for SBC forecasts to become inaccurate. These mistakes can lead to missed targets, misaligned budgeting, and unnecessary financial strain.
Here are the common mistakes and how to avoid them:
Treating SBC as "Set It and Forget It"
You build your forecast once and only revisit it at the end of the year, leading you to big surprises when you’re way off.
- Why it's wrong: Hiring plans change constantly, and your SBC forecast needs to keep up with those changes.
- Fix: Review the forecast monthly and refresh it quarterly. Treat SBC forecasting like your revenue forecast, dynamic and always evolving.
Ignoring Refresh Grants
You focus on new hires but forget that many employees will receive refresh grants.
- Why it's wrong: Refresh grants can make up 30-50% of your total SBC, and they have the same P&L impact as new grants.
- Fix: Create a clear refresh grant policy and model 30-40% of tenured employees receiving refreshes. Use last year’s data to guide your assumptions.
Using Option Count Instead of Grant-Date Fair Value
You estimate SBC expenses based on option count rather than the actual fair value.
- Why it's wrong: Options have a fair value (usually 40-60% of the strike price), not just a strike price.
- Fix: Always use the grant-date fair value in your forecasting. If you don’t have exact calculations, estimate using 50% of the strike price.
Not Adjusting for Timing
You assume hires happen at the beginning of the quarter and model 3 full months of expense.
- Why it's wrong: Hires happen throughout the quarter. Assuming all hires are at the start of the quarter can lead to overestimating the expense.
- Fix: Model hires as happening mid-quarter, and track actual hire dates to refine your assumptions. Adjust for seasonal hiring trends.
Forgetting About 409A Changes
You use today’s strike price for future grants without factoring in potential increases after funding rounds.
- Why it's wrong: A higher strike price means a higher fair value and a bigger expense per grant.
- Fix: Increase your 409A assumption by 15-30% annually, and update your model after funding rounds or valuation changes.
Treating All Departments the Same
You apply a single turnover assumption across the entire company.
- Why it's wrong: Different departments have different turnover rates, which can skew your forecast.
- Fix: Use department-specific turnover rates based on at least 12 months of data. Adjust for known factors, like leadership changes or retention efforts.
Building the Forecast in Isolation
Finance builds the SBC forecast alone, leading to misalignment with hiring plans and equity strategies.
- Why it's wrong: SBC forecasting needs input from multiple teams to align with hiring and equity plans.
- Fix: Set up regular cross-functional meetings with Finance, People Ops, Recruiting, and Department Leaders. Use a shared model for full alignment.
By avoiding these mistakes and following the fixes, your SBC forecast will be more accurate, adaptable, and aligned with company goals. Keep it collaborative, and update it regularly to stay on track. The goal isn't perfection in week one. The goal is to establish a repeatable process that improves quarterly, as you collect more data and refine assumptions.

Conclusion
Stock-based compensation forecasting isn’t just an accounting task—it’s a key part of your strategic planning. When done right, it boosts CFO confidence in budgets, helps CPOs plan hires within equity limits, and gives leadership visibility into one of the largest expense categories.
SBC forecasting should be a collaborative effort between Finance and People Ops. The best forecasts aren’t built in isolation; they’re shaped through regular communication and continuous adjustments based on actual data.
With a solid SBC forecast, you’ll replace guesswork with data, avoid surprises in board meetings, and make smarter decisions about hiring, equity budgets, and long-term planning.
If you’re ready to streamline your SBC forecasting, CandorIQ offers a smart, data-driven solution that integrates seamlessly with your existing systems. Take the next step toward better forecasting, book a demo with CandorIQ, and see how it can help your teams work smarter, not harder.
Frequently Asked Questions
1. How often should I update my SBC forecast?
Review actuals versus forecast monthly and rebuild your full forecast quarterly. This cadence balances accuracy with the time investment required. If you're in a period of rapid hiring or significant organizational change, consider monthly forecast updates.
2. What's a reasonable variance between forecast and actuals?
Aim for ±10% variance by your second quarter of forecasting and ±5% by your fourth quarter. In your first quarter, ±15-20% is acceptable as you're still calibrating assumptions.
3. Should I forecast in option counts or dollar values?
Always forecast in dollar values using grant-date fair value. Option counts are useful for tracking pool capacity, but they don't translate directly to P&L expense.
4. How do I handle grants to executives or board members?
Model these separately as "known future grants" with specific timing and values. Executive grants are often larger and vest differently than standard employee grants, so they warrant their own forecast line items.
5. What if my 409A valuation changes mid-forecast?
Update your model immediately with the new 409A and recalculate fair values for future grants. Historical grants don't change, but all future grants will use the new valuation.
6. Do I need separate forecasts for options and RSUs?
The forecasting methodology is similar, but RSUs have simpler fair value calculations (equal to the FMV at grant date) and no forfeiture discount. If you issue both, track them separately to understand the mix and manage pool capacity appropriately.
Ready to modernize your workforce and compensation strategy?
See how CandorIQ brings workforce planning and compensation together with AI.